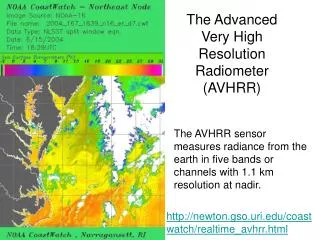
ASTER Advanced Spaceborne Thermal Emission and Reflection Radiometer
640 likes | 992 Vues
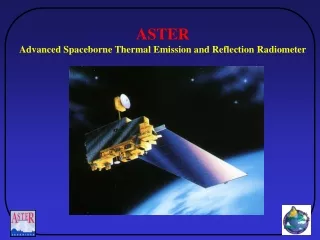
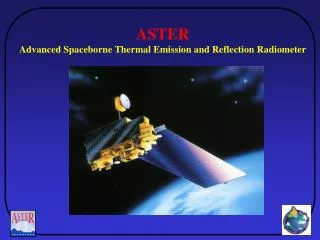
ASTER Advanced Spaceborne Thermal Emission and Reflection Radiometer. Terra Launch from VAFB. Terra Orbit Parameters. Orbit Sun Synchronous Descending Node Time of Day 10:30 am Altitude 705 km Inclination 98.2 o Repeat Cycle 16 days. ASTER Instrument Overview.

ASTER Advanced Spaceborne Thermal Emission and Reflection Radiometer
E N D
Presentation Transcript
ASTER Advanced Spaceborne Thermal Emission and Reflection Radiometer
Terra Orbit Parameters Orbit Sun Synchronous Descending Node Time of Day 10:30 am Altitude 705 km Inclination 98.2o Repeat Cycle 16 days
ASTER Instrument Overview • ASTER is an international effort: • Japanese government is providing the instrument under METI (Ministry of Economy, Trade and Industry) and is responsible for Level 1 data processing • Flies on NASA’s Terra platform • Science team consists of Japanese, American and Australian scientists
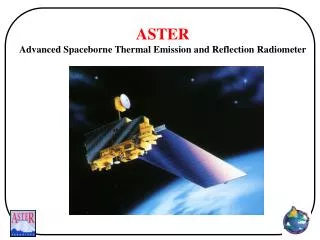
ASTER Characteristics • Wide Spectral Coverage • 3 bands in VNIR (0.52 – 0.86 μm) • 6 bands in SWIR (1.6 – 2.43 μm) • 5 bands in TIR (8.125 – 11.65 μm) • High Spatial Resolution • 15m for VNIR bands • 30m for SWIR bands • 90m for TIR bands • Along-Track Stereo Capability • B/H 0.6 • DEM Elevation accuracy: 15m (3σ) • DEM Geolocation accuracy: 50m (3σ) Terra ASTER
Item VNIR SWIR TIR Scan Pushbroom Pushbroom Whiskbroom Reflective (Schmidt) Refractive Reflective (Newtonian) D=82.25 mm (Nadir) D=190 mm D=240 mm Telescope optics D=94.28 mm (Backward) Dichroic and Spectrum separation Band pass filter Band pass filter band pass filter Si-CCD PtSi-CCD HgCdTe (PC) Focal plane (Detector) 5000 x 4 2048 x 6 10 x 5 Cryocooler (Temperature) not cooled Stirling cycle, 77 K Stirling cycle, 80 K Telescope rotation Pointing mirror rotation Scan mirror rotation Cross-track pointing + 24 deg. + 8.55 deg. + 8.55 deg. Cold plate Cold plate Thermal control Radiator and and Radiator Radiator 2 sets of Halogen lamps 2 sets of Halogen lamps Blackbody Calibration method and monitor diodes and monitor diodes 270 - 340 K ASTER Characteristic Functions
ASTER Cross-Track Pointing • EOS AM-1 Orbit Interval : 172 km on the equator • ASTER Imaging Swath : 60 km • Fixed 7 Pointing Positions • + Arbitrary Pointing (rare cases) • Total Coverage in Cross-Track Direction by Pointing • Full Mode : 232 km (+116 km / +8.55 degrees) • Recurrent Period : 16 days (48 days for average) • VNIR : 636 km (+ 318 km / +24 degrees) • Recurrent Pattern : 2-5-2-7 days (4 days average)
Comparison between ASTER and the other imagers
i : the wavelength TBB : the brightness temperature C1= 3.7415 x 10⁴ (W cm-2 µm4) C2= 1.4388 x 10⁴ (µmK) (Fujisada, 2001) Conversion of DN to Radiance (Level-1A) DN values can be converted to radiance as follows. L = A V /G + D (VNIR and SWIR bands) L = AV + CV2 + D(TIR bands) Where L: radiance (W/m2/sr/µm) A: linear coefficient C: nonlinear coefficient D: offset V: DN value G: gain For TIR, radiance can be converted into brightness temperature using Plank’s Law as shown below.
Level-1B Data Product • The Level-1B data product can be generated by applying the Level1A coefficients for radiometric calibration and geometric resampling. Map projection : UTM, LCC, SOM, PS, Lat/Long Resampling : NN, BL, CC • The geolocation field data are included in the Level-1B data to know the pixel position (latitude/longitude) on the ground. (Fujisada, 2001)
Conversion of DN to Radiance (Level-1B) • Radiance value can be obtained from DN values as follows; Radiance = (DN value -1) x Unit conversion coefficient • Unit conversion coefficients, which is defined as radiance per 1DN, are used to convert from DN to radiance. • The unit conversion coefficient will be kept in the same values throughout mission life. (Fujisada, 2001)
Subsystem Band # Specified Value Measured Value Remarks VNIR 1 > 140 224 Onboard lamp data (slightly lower than the specified input radiance) 2 > 140 200 3N > 140 136 218 SWIR 4 > 140 Onboard lamp data (the minimum values for Lamp-A, higher than the specified input radiance) 5 > 54 177 6 > 54 181 7 > 54 177 8 > 70 213 9 > 54 212 SNRs Measured in Actual Data
ASTER Gain Settings Detection of High Temperature Targets
ASTER Science Team Selects algorithms for higher level standard products Produces software for standard products Conducts joint calibration and validation exercises Conducts mission operations, scheduling, and mission analysis
ASTER Calibration Activities 1. Onboard Calibration Devices VNIR: Halogen lamp + photodiode monitor (dual units) SWIR: Halogen lamp + photodiode monitor (dual units) TIR : Variable temperature blackbody (BB) 2. Onboard Calibration (OBC) (1) Long-term calibration: Every 17 days ( Every 33 days) VNIR, SWIR: Halogen lamp + earth night side observation TIR: BB temperature changed from 270 K to 340 K (2) Short-term calibration: Before each TIR observation TIR: BB temperature fixed at 270 K 3. Vicarious Calibration (VC) VNIR, SWIR: Ivanpah Playa, Railroad Valley Playa, Tsukuba, etc. TIR: Lake Tahoe, Salton Sea, Lake Kasumigaura, etc.
ASTER Instrument Operations • ASTER has a limited duty cycle which implies decisions regarding usage must be made • Observation choices include targets, telescopes, pointing angles, gains, day or night observations • Telescopes capable of independent observations and maximum observation time in any given orbit is 16 minutes • Maximum acquisitions per day Acquired ~750 Processed ~330
Science Prioritization ofASTER data acquisition • NASA HQ, GSFC, and METI have charged the Science Team with developing the strategy for prioritization of ASTER data acquisition • Must be consistent with EOS goals, the Long Term Science Plan, and the NASA-METI MOU • Must be approved by EOS Project Scientist
Global Data Set • A one-time acquisition • All land surfaces, including stereo • Maximize high sun • “Optimal” gain • Consists of pointers to processed and archived granules which: • Meet the minimum requirements for data quality • Are the “best” acquired satisfying global data set criteria • Science Team has prioritized areas for acquisition (high, medium and low)
Regional Data Sets • Focus on specific physiographic regions of Earth, usually requiring multi-temporal coverage • Acquisitions are intended to satisfy multiple users, as opposed to specific requirements of individual investigator or small team • Defined by the ASTER Science Team in consultation with other users (e.g., EOS interdisciplinary scientists) • Science team provides prioritization (relative to other regional data sets) on a case-by-case basis
Targeted Observations • Targeted observations are made in response to Data Acquisition Requests (DARs) from individual investigators or small groups for specific research purposes • Japanese Instrument Control Center (ICC) does prioritization of DAR based on guidelines provided by Science Team • Targeted observation may also be used to satisfy the global data set or regional data set acquisition goals, where appropriate
ASTER Operation Complexity Data Acquisition Based Upon User’s Requests Instrument Operation Constraints (1) Data Rate ・Maximum average data rate : 8.3 Mbps ・Peak data rate : 89.2 Mbps (2) Power Consumption (3) Pointing Change 3. Selection of Operation Mode / Gain Settings 4. Utilization of Cloud Prediction Data Duty Cycle : 8% Automatic Generation of Data Acquisition Schedule
Terra ASTER US-JAPAN Relation TDRS ASTER Sensor Downlink ATLASⅡ Uplink Science data Engineering data Telemetry data Command Direct Downlink TDRSS US Japan data Level-0 data DRS Expedited Data Set ASTER GDS EOSDIS Telemetry data Activity Product Product DAR, DPR DAR, DPR Product ・Data Processing/Analysis (Level 0→Level 1) (High Level Product) ・Mission Operation (Observation Scheduling) ・Data Archive/Delivery User User Pacific Link
ASTER Primary Objectives To improve understanding of the local- and regional-scale processes occurring on or near the earth’s surface. Obtain high spatial resolution image data in the visible through the thermal infrared regions. ASTER is the zoom lens of Terra!
ASTER Web Site: http://asterweb.jpl.nasa.gov
APPLICATIONS • Surface Energy Balance • Geology • Wild Fires • Urban Monitoring • Glacial Monitoring • Volcano Monitoring • Wetland Studies • Land Use
Surface Energy Balance from ASTER data El Reno OK, 4-Sep-2000, Kustas & Norman 2-source model
ASTER data of El Reno OK, 4-Sep-2000: NDVI & Surface Temperature
321 321 DST 468 DST 131210 DST
Hayman Fire, Colorado June 16, 2002 ASTER bands 8-3-2 as RGB
Eiffel Tower Arc de Triomphe Louvre La Defense
Global Land Ice Measurements from Space View from top of Llewellyn Glacier, British Columbia • Goal is to determine the extent of world’s glaciers and the rate at which they are changing. • Acquire global set of ASTER images • Map global extent of land ice • Analyze interannual changes in length, area, surface flow fields
January 2002 Eruption of Nyiragongo Volcano, Congo Nyiragongo erupted January 17, 2002 sending streams of lave through the town of Goma. More than 100 people were killed. This perspective view combines ASTER thermal data (red) showing the active lava flows and lava in the crater; Landsat Thematic Mapper image, and Shuttle Radar Topography Mission digital elevation data.