Download
1 / 42
420 likes | 592 Vues
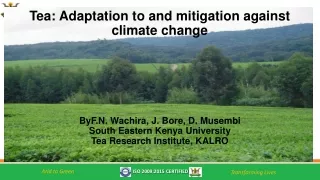
Tea: Adaptation to and mitigation against climate change. By F.N. Wachira , J. Bore, D. Musembi South Eastern Kenya University Tea Research Institute, KALRO. TEA IN AFRICA: AN IMPORTANT CASH CROP. Insert your text here.

E N D
Tea: Adaptation to and mitigation against climate change ByF.N. Wachira, J. Bore, D. Musembi South Eastern Kenya University Tea Research Institute, KALRO
TEA IN AFRICA: AN IMPORTANT CASH CROP Insert your text here. • Source of livelihood to (Directly and Indirectly) about 5 million East Africans and their families • Critical sub-sector- Contributes to the national economies of K, U, T, RW, BU, DRC, Malawi • A rural based enterprise & contributes to rural poverty alleviation • Contributes to Environmental conservation / Carbon sink- sequestration
What is Climate Change (CC)? • Change in global or regional climate patterns due to increased CO2 • El Nino – Associated with warming of the sea surface in the pacific; In EA, it results in increased rainfall depending on strength (or even drought- La Nina), Occurs every 2-6 yrs in EA, Last experienced in 1986/7, 91/92, 94/95, 2002/3, 04/05, 06/07/09/10,15/16, 19 • Frequency of El nino is associated with CC. • Depending on strength it can result in increase or decrease of tea yields (10-20%).
CC- Real or fiction? Is Climate Change real? Is there tangible evidence? How does CC affect my tea business? What should I do?
Evidence of Climate Change at the Global level? Warmest 12 years: 1990,1995, 1997,1998, 1999,2000, 2001, 2002,2003,2004,2005,2006, 2015/2016, 2019?
Further evidence of climate change- The Sea Level • Average ocean tempt • has increased. • Ocean warming causes seawater to expand, contributing to sea level rise. • There has been observed sea level rise from the 19th to the 20th century.
Is there any Evidence of Climate change in E. Africa? About 82 % of the icecap that covered Mt Kilimanjaro surveyed in 1912 is now gone. If the recession continues at the present rate, the majority of the glaciers on Kilimanjaro could vanish in the next 15-20 years
WHAT ARE THE INDICATORS OF CLIMATE CHANGE IN E. AFRICA? • Climate change signals have been evidenced in EA. • Increase in temperature; • Decreasing and erratic rainfall trends; • Melting and retreat of mountain glaciers eg on Mt Kenya, Mt KLM; • Increasing frequency of extreme climate events including floods, droughts, frost, hail SOME OF THE ABOVE HAVE ALSO BEEN EVIDENCED IN TEA AREAS
Rainfall Trends in a major Tea zone (Kericho-TRI, Kenya) 2016 - 1933mm 2017 - 1954mm 2018 - 2319mm Annual Rainfall in mm (1958-2015)- Casual look- trends not very predictable.
Detailed review of rainfall Trends in a major Tea zone (Kericho-TRI, Kenya) There is an annual decrease of 4.82mm. Over a period of 52 years, Rainfall decreased by more than 250mm.
Rainfall Trends in the major Tea growing region of Kericho, Kenya There is a rainfall decrease of 65mm (R² = 0.803) for every ten-year period on average
Trends in Soil water deficits in a major tea zone- Kericho, Kenya 2018 - -347.9mm Soil is getting drier
Trends in Temperature in a major Tea Area- Kericho There is a general increase of temperature
Detailed review of trends in Temperature in a major Tea Area- Kericho 2016- 17.5oC 2017- 17.1oC 2018- 17.0oC There is an annual rise of 0.0160C (R² = 0.331) over a period of 52 years
Change in Mean air temperature over decades in Kericho • There is an average rise of 0.20C (R² = 0.852) for every ten-year period • This is a temperature increase of 10C over the 50 year period.
Magnitude of change in Kenyas’ major Tea areas REGION TREND MAGNITUDE (T max) Western Increase 0.5 –2.1C Central Increase 0.1- 0.7C (T min) Western Increase 0.8-2.9C Central Increase 0.8- 2.0C
Annual Mean maximum tempt., Bushenyi, S.W.Uganda Tempt. started rising after mid 1980s; Similar trend has been observed for Min. Tempt
Annual Mean maximum tempt. Lushoto, N.Tanzania Tempt. started rising after early 1990s; Similar trend has been observed for Min. Tempt
Total Annual Rainfall, Lushoto, N. Tanzania Rainfall has consistently been below normal since the mid 1980s
Annual Mean maximum tempt., Rungwe, S.Tanzania Tempt. started rising in the mid 1980s; Similar trend has been observed for Min. Tempt
Total Annual Rainfall, Rungwe, S. Tanzania Rainfall has consistently been below normal since 1980
Annual Mean maximum temperature, Giswati, Rwanda Tempt. started rising after mid 1980s; Similar trend has been observed for Min. Tempt
Total Annual Rainfall, Giswati, Rwanda There is no indication of change in rainfall trend
Is there effect of CC? The Kenyan situation: Total tea production has continued to increase due to Expan. & Techn. 1963
Effect of weather phenomena on Total production and average yields in Kenya Mild-Strong El Nino
Average Tea Productivity in Kenya and on a Research (TRI) Farm Research and National productivity are correlated. Research yields can be used to extrapolate national productivity trends
Mean air temperature and tea yields at Timbilil, TRI SWD Except for Jan-April when water is limited, increase in tempt. results in increase in production.
Effect of Tempt on National production in Kenya Increasing tempt. Results in higher production
Effect of water on Tea Yields • In Kericho, Yield decreases linearly with increase in SWD • Critical SWD is 120mm • Seasonal SVPD affects yields • Soil Water is the limiting factor for production
Current suitability map of tea production areas in Kenya According to the MAXENT model, most suitable areas for tea are concentrated in the higher areas of : Meru, Embu, Kirinyaga, Nyeri, Murangá, Kiambu, Kisii, Nyamira,Kericho, Bomet, Narok, Migori and Homa Bay.
Future suitability of tea production areas based on climate trends: 2020 In 2020 suitable areas start shifting but the average suitability in all districts remain nearly constant. Productivity too remains almost the same and tea quality will be maintained.
Future suitability of tea production areas based on climate trends: 2050 In 2050 tea production according to its climate-suitability is predicted to be more concentrated in Central Kenya. Productivity may marginally decrease in West of Rift Valley. Tea quality in the west would also be compromised.
Relationship of suitability & altitude • With progressive CC, areas at higher altitudes benefit on tea-suitability • Optimum tea areas-are currently at an altitude of 1500 - 2100 masl • By 2050: • suitability will increase to an altitude between 2000 and 2300 masl • areas at altitudes between 1400 and 1900 masl will suffer the highest decrease in suitability • areas around 2300 masl will have the highest increase in suitability • Overall total production will stabilize or decrease since suitable areas will shrink Similar shifts are expected in the rest of Africa
Other Extreme Weather Phenomena- eg HAIL cause significant crop losses –(Hail in Kenya can cause crop loss of up to an average of 2m kg Mt/yr) Hail is unpredictable. The number of incidences and intensity vary year to Year.
FROST- associated with dry weather conditions: damage is exacerbated by high Fertilizer rates; incidences are increasing
Modification of the tea microclimate- Shade and shelter can mitigate against damage from extreme whether events such as sun scorch, frost and hail and improve physical and chemical properties
Rationalised Tea Breeding to manage abiotic and biotic stress Breeding stocks and their expected genetic contribution in the breeding programme Diversification of the choice of tea cultivars in plantations (Genetic buffering) & deployment of drought and heat tolerant cultivars
GAP can contribute to soil moisture conservation (i) Judicious use of inputs egoptimal rates of fertilizer, microdosing, (ii) Mulching, (iii) optimal pruning, (iv) micro-catchments, (v) weed management etc Water content decreases with increased fertilizer and soil depth.
Practical sustainable intervention strategies • Implement 3 Pillars of Climate Smart Agriculture; Adaptation, mitigation and reduction of Carbon emissions (C foot print) by: • Efficient management of soil and water resources -Precision farming and Judicious use of inputs • Catchment & riverbank protection • Environmental conservation and Sustainable management of forests including reforestation. • Crop diversification • Development and growing of low water demand (drought resistant) cultivars/varieties • Identification of alternate sources of energy (wind, solar, hydro) • Rain water harvesting and irrigation • Consideration of crop insurances
The Way Forward • The following long term measures should also be implemented • Devt. & Implementation of comprehensive climate change programmes – with clear Strategies, policies, and projects • Crop improvement programmes targeting devt of stress tolerant and widely adapted tea cultivars • Explore opportunities to participate in the carbon market • Continuous data and information collection and systematic analysis of weather patterns in Tea growing Zones including modeling and forcasting • Closer collaboration with the private sector in resource mobilisation to support CC adaptation activities • Capacity building focused on awareness creation and farmer education
Sustainability- Succession- Guaranteeing future supply lines? A competitive & sustainable Tea sub-sector (Increased productivity, sustainability,access to input and output markets, supporting and enabling policies) Bequeathing future generations