Download
1 / 41
410 likes | 570 Vues
How much sleep did you get last night?. <6 6 7 8 9 >9. Upcoming in Class. Homework #11 due Monday Start working on the final step of your data project Exam #2 is Thursday April 26 th. Possible Tests. One-proportion z-test Two-proportion z-test One-sample t-test for mean

E N D
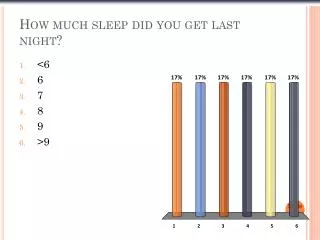
How much sleep did you get last night? • <6 • 6 • 7 • 8 • 9 • >9
Upcoming in Class • Homework #11 due Monday • Start working on the final step of your data project • Exam #2 is Thursday April 26th.
Possible Tests • One-proportion z-test • Two-proportion z-test • One-sample t-test for mean • Two-sample t-test for differences of means
Examples of One-proportion test • Everyone (100%) believes in ghosts • More than 10% of the population believes in ghosts • Less than 2% of the population has been to jail • 90% of the population wears contacts
Examples of Two-proportion tests • Women believe in ghosts more than men • Blacks believe in ghost more than whites • People who have been to jail believe in ghosts more than people who haven’t been to jail • Women smoke more than men • Women use facebook in the bathroom more than men
Examples of One-Sample t-test • All Priuses have fuel economy > 50 mpg • Ford Focuses get 5 mpg on average • The average starting salary for ISU graduates >$100,000 • The average cholesterol level for a person with diabetes is 240.
Examples of two-sample t-test • The MPG for the Prius is greater than the MPG for the Ford Focus • ISU male graduates have a greater starting salary than women • The cholesterol levels are the same for people with and without diabetes.
Ethanol Plant and VOC levels • Near Peoria, IL a struggling ethanol plant was recently fined for toxic wastewater pollution. • In the midwest, the EPA reviews the VOC levels for 25 ethanol plants. The mean VOC for these plants is 300 tons per year, with a SD of 250. • Most of the plants have bypassed a stringent EPA permitting process because they claimed to have levels of VOC emission lower than 100 tons a year.
More Cautions About Interpreting Confidence Intervals • Remember that interpretation of your confidence interval is key. • What NOT to say: • “95% of all the ethanol plants pollute betwee between 214.45 and 385.55 tons per year.” • The confidence interval is about the mean not the individual values. • “We are 95% confident that a randomly selected ethanol plant will pollute between 214.45 and 385.55 tons per year.” • Again, the confidence interval is about the mean not the individual values.
More Cautions About Interpreting Confidence Intervals (cont.) • What NOT to say: • “The mean pollution level of is 300 tons per year 95% of the time.” • The true mean does not vary—it’s the confidence interval that would be different had we gotten a different sample. • “95% of all samples will have pollution levels between 214.45 and 385.55 tons per year.” • The interval we calculate does not set a standard for every other interval—it is no more (or less) likely to be correct than any other interval.
Chapter 23 Inference About Means
From proportions to means • Now that we know how to create confidence intervals and test hypotheses about proportions, it’d be nice to be able to do the same for means. • Just as we did before, we will base both our confidence interval and our hypothesis test on the sampling distribution model.
Notation for the Theory • The Central Limit Theorem told us that the sampling distribution model for means is Normal with mean μ and standard deviation • All we need is a random sample of quantitative data. • And the true population standard deviation, σ. • Well, that’s a problem…
Proportions have a link between the proportion value and the standard deviation of the sample proportion. This is not the case with means—knowing the sample mean tells us nothing about We’ll do the best we can: estimate the population parameter σ with the sample statistic s. Our resulting standard error is Applying the Theory to our Sample
Can’t use Normal Model, must use t-distribution • We now have extra variation in our standard error from s, the sample standard deviation. • And, the shape of the sampling model changes—the model is no longer Normal. So, what is the sampling model?
A practical sampling distribution model for means When the conditions are met, the standardized sample mean follows a Student’s t-model with n – 1 degrees of freedom. We estimate the standard error with The t-distribution and our sample
The standard deviation, s,is just the square root of the variance and is measured in the same units as the original data. The Sample Standard Deviation
T-distribution • Student’s t-models are unimodal, symmetric, and bell shaped, just like the Normal. • But t-models with only a few degrees of freedom have much fatter tails than the Normal.
T-distribution • As the degrees of freedom increase, the t-models look more and more like the Normal. • In fact, the t-model with infinite degrees of freedom is exactly Normal.
Gosset’s t • William S. Gosset, an employee of the Guinness Brewery in Dublin, Ireland, worked long and hard to find out what the sampling model was. • The sampling model that Gosset found has been known as Student’s t. • The Student’s t-models form a whole family of related distributions that depend on a parameter known as degrees of freedom. • We often denote degrees of freedom as df, and the model as tdf.
Finding t-Values By Hand • The Student’s t-model is different for each value of degrees of freedom. • Because of this, Statistics books usually have one table of t-model critical values for selected confidence levels.
Using the t-tables find the following critical-t values • What is the critical value of t for a 90% confidence interval with df=18? • What is the critical value of t for a 99% confidence interval with df 78?
Find p-values • Online Program • http://www.tutor-homework.com/statistics_tables/statistics_tables.html • TI-83/TI-84 • http://www.keymath.com/documents/sia2/CalculatorNotes_Ch09_SIA2.pdf
Using your software, find the following p-values • What is the p-value for t≥2.61 with 4 degrees of freedom? • What is the p-value for |t|>1.81 with 21 degrees of freedom? • What is the p-value for |t|<1.53 with 21 degrees of freedom?
When the conditions are met, we are ready to find the confidence interval for the population mean, μ. The confidence interval is where the standard error of the mean is The critical value depends on the particular confidence level, C, that you specify and on the number of degrees of freedom, n – 1, which we get from the sample size. A Confidence Interval for Means? (cont.) One-sample t-interval for the mean
HW 11 – Problem 6 • A nutrition lab retests the sodium content of hot dogs. • This time they use a sample of 75 ‘reduced sodium’ frankfurters instead of 40. • The NEW sample produces a mean of 319mg with a SD of 31. • The OLD sample produced a mean of 310mg with a SD of 36.
Should the larger sample produce a more accurate prediction of reduced sodium? • More accurate • Less accurate
What is the SE for the new sample? • 31/sqrt(75) • 36/sqrt(75) • 31/sqrt(40) • 36/sqrt(40)
Find the 95% CI, for the new sample • 319± 1.960*3.58 • 319± 1.992*3.58 • 319± 1.665*3.58 • 319± 2.021*3.58
Interpret • 95% of all “reduced sodium” hot dogs will have a sodium content that falls within the interval • We are 95% confident the interval contains the true mean of sodium content in this type of “reduced sodium” hot dog • The interval contains the true mean sodium content in this type of “reduced sodium” hot dogs 95% of the time • 95% of the sodium content in this type of “reduced sodium” hot dog will be contained in the interval.
Food labeling regulations require that food identified as “reduced sodium” must have at least 30% less sodium than its regular counterpart. • Let’s say, we find that the regular hot dog has 465mg of sodium.
Should this hot dog be labeled “reduced” based on the sample? • Yes, b/c a 95% CI is less than the maximum allowable sodium for a ‘reduced sodium’ frank • No, b/c a 95% CI extends above the maximum allowable sodium for a ‘reduced sodium’ frank • No, b/c a 95% CI is less than the maximum allowable sodium for a ‘reduced sodium’ frank
The assumptions and conditions for the one-sample t-test for the mean are the same as for the one-sample t-interval. We test the hypothesis H0: = 0 using the statistic The standard error of the sample mean is When the conditions are met and the null hypothesis is true, this statistic follows a Student’s t model with n – 1 df. We use that model to obtain a P-value. A Test for the Mean One-sample t-test for the mean
Intervals and Tests (cont.) • More precisely, a level C confidence interval contains all of the possible null hypothesis values that would not be rejected by a two-sided hypothesis test at alpha level 1 – C. • So a 95% confidence interval matches a 0.05 level test for these data. • Confidence intervals are naturally two-sided, so they match exactly with two-sided hypothesis tests. • When the hypothesis is one sided, the corresponding alpha level is (1 – C)/2.
To find the sample size needed for a particular confidence level with a particular margin of error (ME), solve this equation for n: The problem with using the equation above is that we don’t know most of the values. We can overcome this: We can use s from a small pilot study. We can use z* in place of the necessary t value. Sample Size
Would a 99% CI be wider or narrower than 98% CI? • Wider • Narrower • Would remain the same
What are the (dis)advantages of the 98% CI? • The 98% CI has a less chance of containing the true mean than the 99% CI, but 99% CI is more precise (narrower) than the 98% CI. • The 99% CI has a less chance of containing the true mean than the 98% CI, but 98% CI is more precise (narrower) than the 99% CI. • The 98% CI has a less chance of containing the true mean than the 99% CI, but 98% CI is more precise (narrower) than the 99% CI.
Suppose we decrease our sample size from n=55 to n=25. How would we expect our 98% CI to change? • Wider • Narrower • The same
How large a sample would you need to estimate the mean body temperature to within 0.1 degrees with 99% confidence. • 0-100 • 101-200 • 201-300 • 301-400 • 400+
Upcoming in Class • Homework #11 due Monday • Start working on the final step of your data project • Exam #2 is Thursday April 26th.