Mutually Exclusive Events and Venn Diagrams
300 likes | 1.06k Vues
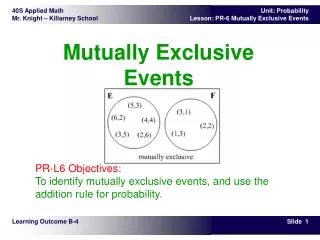
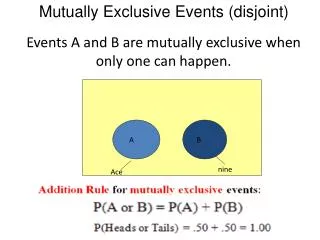
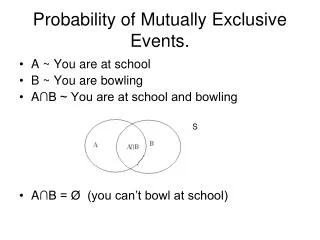
Mutually Exclusive Events and Venn Diagrams. Lesson 10.3. Two outcomes or events that cannot both happen are mutually exclusive. You already worked with theoretical probabilities and mutually exclusive events when you added probabilities of different paths.

Mutually Exclusive Events and Venn Diagrams
E N D
Presentation Transcript
Mutually Exclusive Eventsand Venn Diagrams Lesson 10.3
Two outcomes or events that cannot both happen are mutually exclusive. You already worked with theoretical probabilities and mutually exclusive events when you added probabilities of different paths.
This tree diagram represents the possibilities of success in auditions by Abby, Bonita, and Chih-Lin. • One path from left to right represents the outcome that Abby and Chih-Lin are successful but Bonita is not (outcome AC). • Another outcome is success by all three (outcome ABC). These two outcomes cannot both take place, so they’re mutually exclusive.
Suppose that each student has a 0.5 probability of success. Then the probability of any single path in the tree is (0.5)(0.5)(0.5) = 0.125. So the probability that either AC or ABC occurs is the sum of the probabilities on two particular paths, 0.125 + 0.125, or 0.25.
Just as tree diagrams allow breaking down sequences of dependent events into sequences of independent events, there’s a tool for breaking down non–mutually exclusive events into mutually exclusive events. This tool is the Venn diagram, consisting of overlapping circles.
Example A • Melissa has been keeping a record of probabilities of events involving • Her violin string breaking during orchestra rehearsal (Event B). • A pop quiz in math (Event Q). • Her team losing in gym class (Event L). Event B Event L Event Q
Although the three events are not mutually exclusive, they can be broken into eight mutually exclusive events. a. What is the meaning of the region labeled 0.01? b. What is the meaning of the region labeled 0.03? c. What is the probability of either a pop quiz or Melissa’s team losing today? d. Find the probability of a pretty good day, P(not B and not Q and not L). This means no string breaks and no quiz and no loss.
a. What is the meaning of the region labeled 0.01? The region labeled 0.01 represents the probability of a really bad day. In this intersection, or overlap, of all three circles, Melissa’s string breaks, she gets a pop quiz, and her team loses. The word and is often associated with the intersection.
b. What is the meaning of the region labeled 0.03? The region labeled 0.03 represents the probability that Melissa’s string will break and her team will lose, but there will be no pop quiz in math.
c. What is the probability of either a pop quiz or Melissa’s team losing today? You can find the probability of either a pop quiz or the team losing by adding the probabilities in regions inside the two circles: 0.02 + 0.09 + 0.01 + 0.04 + 0.03 + 0.20 = 0.39. This is the same as finding the union of the two circles. The word or is often associated with the union.
d. Find the probability of a pretty good day, P(not B and not Q and not L). This means no string breaks and no quiz and no loss. The probability of a pretty good day, P(not B and not Q and not L), is pictured by the region outside the circles and is 0.57.
Addition Rule Of the 100 students in 12th grade, 70 are enrolled in mathematics, 50 are in science, 30 are in both subjects, and 10 are in neither subject. • Step 1 “A student takes mathematics” and “a student takes science” are two events. Are these events mutually exclusive? Explain.
Step 2 Complete a Venn diagram, similar to the one below, that shows enrollments in mathematics and science courses. • Step 3 Use the numbers of students in your Venn diagram to calculate probabilities.
Step 4 Explain why the probability that a randomly chosen student takes mathematics or science, P(M or S), does not equal P(M) P(S). • Step 5 Create a formula for calculating P(M or S) that includes the expressions P(M), P(S), and P(M and S).
Step 6 Suppose two dice are tossed. Draw a Venn diagram to represent the events A = “sum is 7” B = “both dice > 2” Find the probabilities in parts a–e by counting dots: a. P(A) b. P(B) c. P(A and B) d. P(A or B) e. P(not A and not B) f. Find P(A or B) by using a rule or formula similar to your response in Step 5.
Step 7 Complete the statement: For any two events A and B, P(A or B) =_______ .
You might wonder whether independent events and mutually exclusive events are the same. • Independent events don’t affect the probabilities of each other. • Mutually exclusive events affect each other dramatically: If one occurs, the probability of the other occurring is 0.
But there is a connection between independent and mutually exclusive events. • In calculating probabilities of non–mutually exclusive events, you use the probability that they both will occur. • In the case of independent events, you know this probability.
Example B • The probability that a rolled die comes up 3 or 6 is 1/3. What’s the probability that a die will come up 3 or 6 on the first or second roll? Let F represent getting a 3 or 6 on the first roll, regardless of what happens on the second roll. Let S represent getting a 3 or 6 on the second roll, regardless of what happens on the first roll.
Example B • The probability that a rolled die comes up 3 or 6 is 1/3. What’s the probability that a die will come up 3 or 6 on the first or second roll? Notice that both F and S include the possibility of getting a 3 or 6 on both rolls, as shown by the overlap in the Venn diagram. To compensate for the overlap, the general addition rule subtracts P(F and S) once.
Example B • The probability that a rolled die comes up 3 or 6 is 1/3. What’s the probability that a die will come up 3 or 6 on the first or second roll? F and S are independent, so P(F and S)= P(F) •P(S). The probability of getting a 3 or 6 on the first or second roll is 5/9 .
When two events are mutually exclusive and make up all possible outcomes, they are referred to as complements. The complement of “a 1 or a 3 on the first roll” is “not a 1 and not a 3 on the first roll,” an outcome that is represented by the regions outside the F circle. Because P(F) is 1/3 , the probability of the complement, P(not F), is 1 – 1/3 , or 2/3 .
Example C • Every student in the school music program is backstage, and no other students are present. Use O to represent the event that a student is in the orchestra, C to represent the event that a student is in the choir, and B to represent the event that a student is in the band. A reporter who approaches a student at random backstage knows these probabilities: • P(B or C) = 0.8 • P(not O) = 0.6 • P(C and not O and not B) = 0.1 • O and C are independent • O and B are mutually exclusive
i. P(B or C) = 0.8 means that 80% of the students are in band or in choir. ii. P(not O) = 0.6 means that 60% of the students are not in orchestra. iii. P(C and not O and not B) = 0.1 means that 10% of the students are in choir only. iv. “O and C are independent” means that the percentage of orchestra students in choir is the same as the percentage of all students in choir. Being in orchestra does not make a student any more or less likely to be in choir, and vice versa. v. “O and B are mutually exclusive” means that there are no students in both orchestra and band. • Turn each of these statements into a statement about percentage in plain English.
Start with a general Venn diagram showing the overlap of 3 events. Because every student backstage is in the music program, the probability P(not C and not O and not B) = 0. So the region Z in the Venn diagram has a probability of 0, and thus Z = 0. Because O and B are mutually exclusive, T = 0 and V = 0. P(C and not O and not B)= 0.1 means that Y =0.1. P(B or C) = 0.8 means that T+U+V+W+X+Y=0.8 so U+W+X=0.7. P(not O) =0.6 means that U+X+Y+Z=0.6 or U+X=0.5. The difference in the last two statements, (U+W+X) - (U+X), is 0.2 so W.=0.2. • b. Create a Venn diagram of probabilities describing this situation. Y=0.1 z=0 T=0 V=0 W=0.2 S=0.2 P(not O) = 0.6 means P(O) = 0.4. Therefore, S+ W+ T+ V = 0.4 or S=0.2 Because O and C are independent P(O)P(C)= P(O and C)
b. Create a Venn diagram of probabilities describing this situation. Because O and C are independent P(O) • P(C)= P(O and C) (0.4)(0.1 + 0 + X + 0.2) = 0.2 + 0 + 0 (0.4)(X + 0.3) = 0.2 X + 0.3 = 0.5 X = 0.2 Since P(not O) = 0.6, U+0.2+0.1+0=0.6 Or U +0.3=0.6 or U=0.3 X=0.2 U=0.3 Y=0.1 z=0 T=0 V=0 W=0.2 S=0.2