Understanding Aggregate Demand and Supply in Economic Fluctuations
400 likes | 522 Vues
This chapter investigates the principles of aggregate demand (AD) and aggregate supply (AS) and their impact on economic fluctuations. It explores how factors like consumption, investment, and government purchases influence AD, as well as how the general price level affects real output in AS. The chapter highlights equilibrium in the economy and contrasts it with potential output. Additionally, it examines Canada's historical economic growth and the dynamics of shifting AD and AS curves, providing insights into the factors that drive changes in economic activity.

Understanding Aggregate Demand and Supply in Economic Fluctuations
E N D
Presentation Transcript
Economic Fluctuations Chapter 11
Chapter Focus • Learn about aggregate demand and the factors that affect it • Analyze aggregate supply and the factors that influence it • Study the economy’s equilibrium and how it differs from its potential • Examine Canada’s historical record of economic growth
Aggregate Demand • Aggregate Demand (AD) • Is the relationship between the general price level and real expenditures • Real expenditures: total spending in an economy, adjusted for changes in the general price level Real expenditures= nominal dollars GDP deflator • Is shown using a schedule or curve
The Aggregate Demand Curve • As the general level of prices increases, less real output is bought for two reasons • The value of financial assets, such as bank accounts and bonds, decreases. As a result, households feel less wealthy, so they reduce their consumption spending. • Net export spending is reduced, as both foreigners spend less on Canadian exports and Canadian residents spend more on imports
Wealth Effect • A household may have wealth in the form of financial assets as well as real assets. The nominal values of these financial assets stay the same, no matter what the price level. However their real values change with any rise or fall in the price level. Real value of financial assets = nominal value of financial assets price level • With changes in the price level, the real value of households’ financial assets changes, causing households to adjust their spending.
Foreign Trade Effect • When the price level in Canada rises, Canadian exports become more expensive for foreigners. As a result, sales in foreign markets fall, causing a decrease in export expenditures. • When products are imported into Canada, they become cheaper relative to higher-priced domestic products due to the high price levels. • Import expenditures by Canadians rise.
Changes In Aggregate Demand • Aggregate Demand changes are shown by shifts in the Aggregate Demand Curve • An increase in spending causes a rightward shift in the AD curve • A decrease in spending causes a leftward shift in the AD curve
Aggregate Demand Factors • Consumption (C) • Disposable Income • Wealth • Consumer Expectations • Interest Rates 2. Investments (I) • Interest Rates • Business Expectations 3. Government Purchases (G) • Net Exports (X-M) • Foreign Incomes • Exchange Rates
Investment Demand • Investment demand is a relationship between the interest rate and investment and depends on the real rate of return and the real interest rate • Businesses pursue projects whose real rate of return at least equals the real interest rate, which means the investment demand curve is downward sloping (since more projects are profitable at lower interest rates)
Aggregate Supply • Aggregate supply (AS) • Is the relationship between the general price level and real output in an economy • At higher price levels in the economy, businesses are encouraged to produce more; at lower price levels, businesses may not be able to make a profit or breakeven in the short run, so they reduce output. • Is shown using a schedule or curve
The Aggregate Supply Curve • The AS curve becomes steep above potential output because a relatively large increase in the price level is required if businesses are to increase output in this range
Short-Run Changes in Aggregate Supply • Short-run AS changes are shown by shifts in the AS curve and a constant potential output for the economy • a short-run increase in AS occurs when the AS curve shifts rightward while potential output stays constant • a short-run decrease in AS occurs when the AS curve shifts leftward while potential output stays constant
Long-Run Changes in Aggregate Supply • Long-run AS changes are shown by shifts in both the AS curve and in potential output • a long-run increase in AS occurs when the AS curve and potential output both shift rightward • a long-run decrease in AS occurs when the AS curve and potential output both shift leftward
Aggregate Supply Factors • AS changes are caused by aggregate supply factors related either to short-run or long-run trends • short-run changes in AS are caused by varying input prices • long-run changes in AS are caused by varying • resource supplies • productivity • government policies
Equilibrium in the Economy • An economy.s equilibrium occurs at the intersection of the AD and AS curves • A price level above equilibrium means an unintended increase in inventories (or positive unplanned investment), lowering the price level towards equilibrium • A price level below equilibrium leads to an unintended decrease in inventories (or negative unplanned investment), raising the price level towards equilibrium
Equilibrium in the Economy • An economy.s equilibrium occurs at a point where total injections (I+G+X) equal total withdrawals (S+T+M) • When total injections exceed total withdrawals then real output and spending expand until a new balance is achieved • When total withdrawals exceed total injections then real output and spending contract until a new balance is achieved
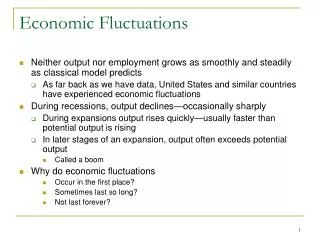
Recessionary and Inflationary Gaps • A recessionary gap • Occurs when equilibrium output falls short of potential output and is associated with an unemployment rate above the natural rate • An inflationary gap • Occurs when equilibrium output exceeds potential output and is associated with an unemployment rate below the natural rate as well as increased pressure on prices
Economic Growth • Economic growth can be defined in two ways • The percentage increase in an economy’s total output (e.g. real GDP) is most appropriate when measuring an economy’s overall productive capacity • The percentage increase in per capita output (e.g. per capita real GDP) is most appropriate when measuring living standards
Economic Growth in Canada • Before World War I (1870-1914), Canada.s per-capita output (in 1992 dollars) more than doubled from $2143 to $4896. • In the interwar period (1914-1945), the country.s per-capita real output almost doubled from $896 to $8953. • In the postwar period (1945-), per capita real output more than tripled to $27982 by 1999.
Economic Growth & Productivity • Growth in per capita output is closely associated with growth in labour productivity which depends on factors such as • The quantity of capital • The quality of labour • Technological progress
Business Cycles • The business cycle is the cycle of expansions and contractions in an economy • An expansion is a sustained rise in real output • A contraction is a sustained fall in real output • A peak is the point in the business cycle at which real output is at its highest • A trough is the point in the business cycle at which real output is at its lowest
Contractions • A Contraction • is usually caused by a decrease in AD magnified by the reactions of both households and businesses, who spend less due to pessimism about the future • may be a recession, which is a decline in real output for six months or more • may be a depression, which is a particularly long and harsh period of reduced real output
Expansions • An Expansion • is usually caused by an increase in AD magnified by the reactions of both households and businesses as they spend more due to more optimistic expectations of the future
The Role of Expectations • As in periods of contraction, expectations play a role in maintaining a recovery. Initial increases in real output and spending lead to optimistic forecasts of continuing growth. • Therefore, consumption, investment, and exports all increase.