Economic Fluctuations I
Economic Fluctuations I FIRST STEPS What are recessions? What causes them? Why do they end? A role for government? This morning’s headlines First key idea of the theory of economic fluctuations Recessions and “booms” are departures of real GDP from potential GDP


Economic Fluctuations I
E N D
Presentation Transcript
Economic Fluctuations I FIRST STEPS
What are recessions?What causes them? Why do they end? A role for government?
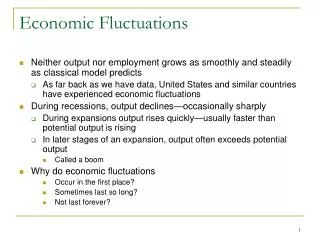
First key idea of the theory of economic fluctuations • Recessions and “booms” are departures of real GDP from potential GDP
Second key idea of the theory of economic fluctuations. • The departures are due to changes in demand (aggregate demand). But why?
What about fluctuations in potential GDP? • These are usually too smooth to explain recessions. • Rarely is there a huge decline in labor, capital, or technology at the time of a recession • Exceptions are important and have huge effects, but not the typical recession • AIDS epidemic in Africa • Hurricane Mitch in central America
Using the Key Ideas • Aggregate demand can be obtained by adding up spending: C + I + G + X • Example: forecast real GDP for 1999 • Y = C + I + G + X • BUT WATCH OUT: C depends on Y, because Y is income too: example C = 1000 + .6YY = C + I + G + X • To see the implications of this dependence, put I and X on the backburner for now
A consumption function: Algebra example:C = 1000 + .6Yor innumerical form:
Making sure both relationships are satisfied • Income (which equals spending) depends on consumption • Or in equation form,Y = C + I + G + X • this is the income-spending identity • Consumption depends on income • Or in equation from,C = 1000 + .6Y • this is the consumption function
Economists fool around with the second relationship (the consumption function) a little bit • They add investment (I), government purchases (G), and net exports (X) to the consumption function • They get a total sum which shows how C + I + G + X depends on income • They call this “total sum” the aggregate expenditure line
Note that the AE line shifts up and down if G or I or Xchange (question: what is the effect of the Asian financial crisis on AE in the United States?)
Now let’s remind ourselves that spending equals income; graphically this gives the 45-degree line
Put the AE line and the 45 degree line together to get spending balance
Sometimes numerical examples help one see spending balance better
Finally, let’s imagine that the AE line shifts down, perhaps because of the Asian financial crisis
In general, when the AE line shifts, real GDP falls (d) or rises (e)
It is hard to imagine the AE line shifting. Can you show how this works with animated graphics or just a blackboard?
These falls or rises take real GDP away from potential GDP • They are the first steps toward recession (d) or boom (e)
But they are not the final steps • To see what happens next (and ultimately to see why the economy recovers from recession), we need to look at the forces of adjustment in the economy • These forces are the subject of the next lecture