Download
1 / 11
110 likes | 213 Vues
Explore the causes of the Somerset Levels floods, analyzing the roles of Human and Physical Geography factors. Who is to blame? Should dredging have been done? Dive into the debate and make your own conclusions in this informative study.

E N D
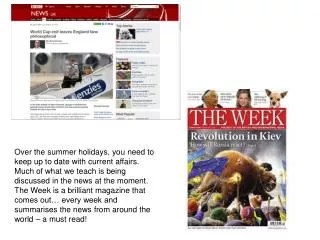
Over the summer holidays, you need to keep up to date with current affairs. Much of what we teach is being discussed in the news at the moment. The Week is a brilliant magazine that comes out… every week and summarises the news from around the world – a must read!
The Sandwich flood reminds us that nature can have a dramatic impact on our lives. The information on the next page is about the flood of the Somerset Levels this winter and is about who you think is to blame for those floods.
Read this information about the floods on the Somerset Levels Background: Between December 2013 and February 2014 the Somerset Levels, an area of flat and low laying land near the Bristol Channel suffered large scale flooding. The immediate cause of the flooding was prolonged and exceptionally heavy rainfall which led to the main rivers – the Parrett and Tone – overtopping and inundating 17 000 acres and flooding 600 homes. The main economic impact was on farming – mostly loss of dairy pastoral land. A key issue in the floods controversy was whether the rivers should have been dredged by the Environment Agency. Most effected were farmers who had to move thousands of head of cattle and face contamination of their land. They had warned that failure to dredge the Parrett and Tone would lead to flooding. Many were unhappy that flood defence investment had gone into developing lower course nature reserve and wetland areas. There were also unhappiness about the lack of government interest as the flooding was happening. Politically a usually Conservative voting group were considering voting UKIP (United Kingdom Independence Party) representing a threat to the Conservative government. However, farmers had also been draining their farmland (so increasing flow into the rivers) and planting extensive areas of maize on the upper slopes of the rivers: this crop had increased surface flow of water and increased soil erosion – which had been deposited into the Parrett and Tone. Both these schemes has been encouraged by the government. Ducks and geese rather liked the nature reserves and wetland, and the mud banks in the undredged rivers. Expansion of farming had threated their habitat and extensive maize instead of grass and other grains has reduced food supplies. Many had considered voting UKAP – UK Avian Party Environment Agency was responsible for flood protection both short and long term. They had been advised that dredging would not stop flooding but that trying to change farming practices and creating areas of storage – nature reserves and wet lands – would be better long term forms of protection. They had also had their budget severely cut by the government. Soft engineering options such as nature reserves had less impact on the environment, and were cheaper than large scale hard defences such as flood walls and dredging that local people had wanted. They were aware that land drainage schemes and farming maize increased flood risk but this funding had come from the government and so to openly criticise it would be politically disadvantageous. The government initially misunderstood the scale of flooding. Somerset was a long way from London and not of immediate concern. Similarly the population was small. Main concern of government was to reduce funding as much as possible and so had cut spending on flood defence and also the Environment Agency’s budget. When the flooding became national news the attitude changed (especially with the risks of losing votes) with a commitment to “spare no expense” to protect the Somerset Levels – although much of this money came from reducing spending on other flood defence projects so exposing other parts of the country to flood risk. Government was keen to avoid criticism and so tried directing blame at mismanagement by Environment Agency include criticising emphasis on soft defences such as nature reserves and wet lands instead of flood walls and failing to dredging.
Answer these questions Were the causes of the floods down to Human or Physical Geography or a combination? Who left the locals unprotected – Government, Environment Agency or the locals themselves? What should have been done to manage the flooding risk? Is this a straightforward decision?
We look at how and why populations change and the links to health And what the impact of those changes are…
Jobs related to AS Human Geography • Public health campaigner – encouraging more healthy behaviour. • Running family planning programmes • Epidemiologist – researcher of diseases and what causes them • Demographer – researcher into population growth
How do we measure population and health? Link the definition to the Indicator. Population Indicators Is this measure higher or lower for a rich country compared to a poor country. Put an up arrow in the box if it’s higher and a down arrow if it’s lower Definitions The number of babies born alive (live births) per 1000 people in the population, measured in 1 year. Life expectancy If you take 1000 people in the population of a country, how many will die in 1 year. Death rate (DR) How many years the average person can expect to live. Birth rate (BR) The difference between no. of immigrants (in migrants) and emigrants (out migrants) in a country in a year, for every 1000 people living there. Net migration rate The average number of children born to a woman in her lifetime. Population growth rate The level at which each generation has only enough children to replace themselves (2.1 in the UK) Total Fertility Rate (TFR) The % the population has changed (grown or shrunk) in one year. Includes migration. Infant mortality rate Replacement level fertility If you take 1000 babies, how many are sadly going to die before they reach their first birthday.
We played a game of Top Trumps with Population & Health Statistics • The country with the highest death rate • The country with the lowest death rate • The country has the highest birth rate • The country with the lowest birth rate • The country with the highest Life Expectancy • The country with the lowest Life Expectancy UK in 1871 22/1000 Saudi Arabia 2/1000 Gambia 38/1000 Japan 7/1000 Japan 82 years UK in 1871 41 years
What is the relationships between economic development and improved health – measured by life expectancy? An average of $100 a day and expect to live to 80. Low income Middle income High income Still relatively poor compared to the richest countries but live to 70-75 An average of $1 a day and expect to live to 45.