Download
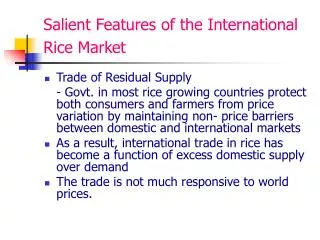
1 / 26
260 likes | 279 Vues
This study by Eric Wailes from the University of Arkansas examines the market access of U.S. rice exports through a Composite Index of Market Access (CIMA) across 160 countries from 2006-2008. The research delves into the U.S. rice sector's structure, pricing dynamics, costs, subsidies, and taxes, utilizing data from USDA, WTO, and industry sources. The study focuses on major U.S. rice import markets, export types, industry infrastructure, and pricing mechanisms. It evaluates barriers to market access, calculates the CIMA, and discusses the significance of this index in trade negotiations and dispute resolutions, highlighting challenges in data collection for differentiated products and reliance on private sector information.

E N D
A Composite Index of Market Access for the Export of Rice from the U.S Eric Wailes, University of Arkansas
Overview Study approach US rice sector structure Price Ladder Prices Costs Subsidies/Taxes Assessment of CIMA
Study approach US export a wide variety of rice types to 160 countries Composite Index of Market Access (CIMA) Used similar methods as Uruguay and Thailand case studies Period of study: 2006, 2007 and 2008
Data sources Trade data USDA FAS GATS online (10 digit HS schedule) UN COMTRADE Price data USDA Cost data Industry sources and cost models Subsidies and tax data WTO, USDA
Market structure of US Rice ~ 10,000 farms ~2,000 on-farm drying/storage facilities ~ 300 commercial elevators (attached/unattached to mills) ~ 40 rice mills (cooperatives are dominant in Arkansas and California) Major export ports: New Orleans, San Francisco, Houston
Price Ladder Prices received by farmers Elevator/mill paddy price Processed price at mill Port price (FOB) Destination price (CIF) Final price at importer
Prices received by farmers Source: USDA, ERS, Rice Outlook, 2008
Prices at elevator/mills Rough rice price Equals Farm price Plus: Transport cost farm to elevator/mill $9.92/mt Drying/storage costs $ 29.39 / mt Assume average storage 6 months Inspection/grading costs $ 1.76 / mt Source: Industry sources
Prices at elevator/mills Processed price Rough rice price at mill Converted to milled equivalent Brown rice (conversion factor 0.8) Milled rice (converstion factor 0.55 (long), and 0.6 (medium)) Plus: Milling costs: Brown $45.45/mt; White $54.54/mt Source: Industry sources and cost models
Prices at ports (FOB) Elevator rough rice price or mill processed price Plus: Transport cost to port from elevator or mill Inspection and certification fees Inspection fees $3.31/mt GM certification $10/mt Source: Industry sources and cost models
Prices at importer (CIF) Export price (FOB) Plus: Ocean freight rates and insurance Mexico: $30/mt EU: $87/mt Turkey: $95/mt Japan: $86/mt Source: Industry sources and cost models
Prices at importer (with taxes/subsidies) Import price (CIF) Plus: Duties and taxes Mexico: $0/mt EU: 65 euro/mt plus 4% VAT Turkey: 34% ad valorem/mt Japan: Markup 292 Yen/kg for MA and 341 Yen/kg for over MA Source: WTO, USDA, EU Commission
Calculation of CIMA Barriers to Market Access (BMA) equals Import duties + Excise taxes + health/safety standard costs Barrier to market access percentage (BMAP) equals BMA/Import price (CIF) * 100 CIMA = 1 – BMAP Source: WTO, USDA, EU Commission
Comments/questions about CIMA Are all forms of protection quantifiable? Licensing, TRQs, etc. Why aggregate? Value as a benchmark? Value in negotiations? Value in dispute resolution?
Data issues for CIMA More difficult for more differentiated products Easier for countries with strong information/data systems about production, processing and marketing costs To extent that data relies on private sector, it invites strategic behavior in terms of access to and quality of information provided.