Download
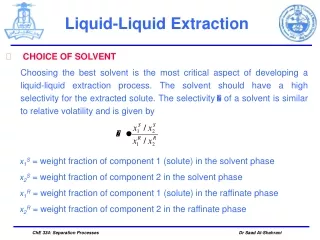
1 / 21
220 likes | 464 Vues
THERMODYNAMICS OF SEPARATION OPERATIONS. Thermodynamic properties and equations play a major role in separation operations, particularly with respect to energy requirements, phase equilibria, and sizing equipment.

E N D
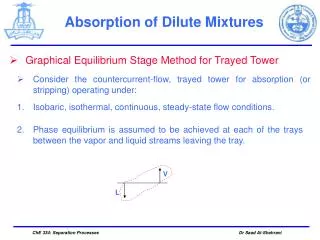
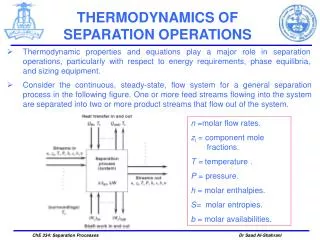
THERMODYNAMICS OF SEPARATION OPERATIONS • Thermodynamic properties and equations play a major role in separation operations, particularly with respect to energy requirements, phase equilibria, and sizing equipment. • Consider the continuous, steady-state, flow system for a general separation process in the following figure. One or more feed streams flowing into the system are separated into two or more product streams that flow out of the system. n =molar flow rates. zi= component mole fractions. T = temperature . P = pressure. h = molar enthalpies. S= molar entropies. b = molar availabilities. ChE 334: Separation Processes Dr Saad Al-Shahrani
THERMODYNAMICS OF SEPARATION OPERATIONS • ENERGY, ENTROPY, AND AVAILABILITY BALANCES • Energy balance: • Entropy balance: • Availability balance: where b = h − T0s = availability function ChE 334: Separation Processes Dr Saad Al-Shahrani
THERMODYNAMICS OF SEPARATION OPERATIONS • Minimum work of separation: • Second-law efficiency: Where LW = T0Sirr = lost work ChE 334: Separation Processes Dr Saad Al-Shahrani
THERMODYNAMICS OF SEPARATION OPERATIONS • The criterion of equilibrium is that all potentials for change are in balance: there are no changes in the equilibrium state and no tendency to leave that state • For three phases (vapor (V), Liquid (L), and solid (S), the temperatures and pressures must be equal at equilibrium: TV=TL=TS thermal equilibrium PV=PL=PS mechanical equilibrium ChE 334: Separation Processes Dr Saad Al-Shahrani
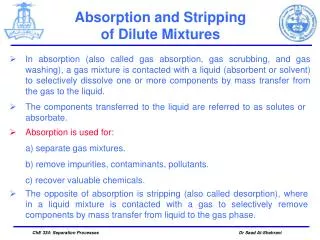
BINARY VAPOR-LIQUID EQUILIBRIUM • Vapor-liquid equilibrium data can be measured by placing a mixture of the two components in a vessel held at either constant temperature or constant pressure • Equilibrium between the liquid and vapor phases will be approached slowly, but may be promoted by agitating the vessel or by circulating the vapor phase so that it bubbles through the liquid. ChE 334: Separation Processes Dr Saad Al-Shahrani
BINARY VAPOR-LIQUID EQUILIBRIUM • After equilibrium, the pressure and temperature are measured and samples are taken to determine the vapor and liquid compositions. • There are several different types of plots for binary system: 1. Pxydiagram: x and y as functions of pressure at constant temperature. 2. Txy diagram: x and y as functions of temperature at constant pressure. 3. xy diagram: x versus yat constant pressure (temperature is a parameter along the curve). • Since most applications require data at constant pressure, Txy and xy diagrams are the most commonly used. ChE 334: Separation Processes Dr Saad Al-Shahrani
Constant T PL Pure light Subcooled liquid y x Two-phases region Pressure Superheated Vapor PH Pure heavy 1.0 x, y 0 Composition (mole fraction light component BINARY VAPOR-LIQUID EQUILIBRIUM 1. Pxy Diagrams • Pxy diagram for a binary mixture at constant temperature. In this diagram, compositions are given as mole fraction of the light component • The upper curve gives the liquid composition x versus pressure P. The lower curve gives the vapor composition y versus pressure. PH= vapor pressure of pure heavy component at the temperature at which the data were collected (x=0). PL= vapor pressure of pure light component at the temperature at which the data were collected (x=1.0). ChE 334: Separation Processes Dr Saad Al-Shahrani
x Subcooled liquid y P1 Pressure Superheated Vapor 1.0 x1 0 y1 x, y Composition (mole fraction light component BINARY VAPOR-LIQUID EQUILIBRIUM • The liquid and vapor compositions x1 and y1 are obtained from the intersection of the phase envelope with the P1constant pressure line. Constant T ChE 334: Separation Processes Dr Saad Al-Shahrani
Saturated liquid line x Subcooled liquid PBP y Saturated vapor line P1 PDP Pressure Superheated Vapor xDP z y1 yBP x1 1.0 0 Composition (mole fraction light component BINARY VAPOR-LIQUID EQUILIBRIUM Constant T • For composition z. If the pressure is increased at constant temperature to PDPaliquid phase will begin to form. • PDP is called the dew point pressure, because the first drops of liquid form as "dew." • The liquid droplets that form will be much leaner in the light component. The composition of the first drop of liquid formed at PDPis xDP. ChE 334: Separation Processes Dr Saad Al-Shahrani
BINARY VAPOR-LIQUID EQUILIBRIUM • As the pressure is increased further, more liquid forms. At a pressure P1there is almost as much liquid of composition x1as vapor of composition y1. • As the pressure is further increased, PBPis reached. Here the last bit of the vapor phase exists as bubbles, so this pressure is known as the bubble point pressure of the mixture with composition z at the specified temperature. ChE 334: Separation Processes Dr Saad Al-Shahrani
TH y Superheated Vapor x TDP Saturated vapor line T1 TBP Temperature TL Subcooled liquid Saturated liquid line xDP z 1.0 x1 y1 yBP 0 Composition (mole fraction light component) BINARY VAPOR-LIQUID EQUILIBRIUM • Txy Diagrams • The boiling point temperature of the pure light component TLat the pressure specified in the diagram is the temperature at the point x = y = 1. THis the boiling temperature of the heavy component at the system pressure. ChE 334: Separation Processes Dr Saad Al-Shahrani
BINARY VAPOR-LIQUID EQUILIBRIUM • The mixture is all liquid until it reaches the bubble point temperature TBP, where the first bubble of vapor forms and has a composition yBp. • Increasing the temperature further to the dew point temperature TDPyields a mixture that is all vapor. The last drops of liquid have a composition xDP. ChE 334: Separation Processes Dr Saad Al-Shahrani
BINARY VAPOR-LIQUID EQUILIBRIUM • Effect of pressure on Txy diagram TH at P2 If Txy diagrams for the same system at different total pressures, then: TL at P2 y 1. P2 > P1 x TH at P1 T 2. The vapor-liquid equilibrium temperatures are higher at P2than at P1 y x 2. The phase equilibrium lines at the higher pressure are usually closer together. TL at P1 1.0 x and y 0 ChE 334: Separation Processes Dr Saad Al-Shahrani
Equilibrium curve y x 45 O line 0.4 Vapor composition y (mole fraction, light component) yA=1- xA yA= xA 0.2 Liquid composition x (mole fraction, light component) BINARY VAPOR-LIQUID EQUILIBRIUM xy Diagrams xy diagram for binary system • xy diagram for a binary system, relates the compositions of the liquid and vapor phases in equilibrium with each other. • These diagrams can be generated from either constant-P or constant-T data. However, they are most commonly drawn for constant pressure, since most applications are essentially isobaric. ChE 334: Separation Processes Dr Saad Al-Shahrani
BINARY VAPOR-LIQUID EQUILIBRIUM • If the diagram is plotted for a constant pressure, temperature is a parameter along the curve. • If the diagram is plotted for a constant temperature, pressure is a parameter along the curve. ChE 334: Separation Processes Dr Saad Al-Shahrani
BINARY VAPOR-LIQUID EQUILIBRIUM Example: In a 2-component (binary) mixture, an equilibrium condition can exist between the vapour and the liquid phase. The Figure shows a typical equilibrium condition attained under a certain pressure P and temperature T. The 2 components that made up the mixture distribute themselves unequally in both the vapour and liquid phases. The substance with the lower boiling point is known as the more volatile component (MVC) and correspondingly the substance with the higher boiling point is known as the less volatile component (LVC). If we let A = MVC and B = LVC, we can use mole fractions as a measure of concentrations of the components in the 2 phases: yA = mole fraction of component-A in the vapour phase. xA = mole fraction of component-A in the liquid phase ChE 334: Separation Processes Dr Saad Al-Shahrani
BINARY VAPOR-LIQUID EQUILIBRIUM At a different temperature and/or pressure, the 2-components will distribute differently. For example, the Figure shows equilibrium at pressure P and temperature T1. The mole fraction of A in the vapour and liquid are yA1 and xA1 respectively. ChE 334: Separation Processes Dr Saad Al-Shahrani
BINARY VAPOR-LIQUID EQUILIBRIUM At another higher temperature T2 but at the same pressure P, another equilibrium is attained, with different mole fractions than at temperature T1. As shown in the Figure, the mole fractions of A in the vapour and liquid are yA2 and xA2 respectively. ChE 334: Separation Processes Dr Saad Al-Shahrani
BINARY VAPOR-LIQUID EQUILIBRIUM ChE 334: Separation Processes Dr Saad Al-Shahrani
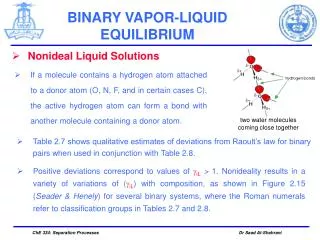
BINARY VAPOR-LIQUID EQUILIBRIUM • NONIDEALITY IN VAPOR-LIQUID EQUILIBRIUM • At low and moderate pressures, nonideal vapor-liquid equilibrium can be described by modified raoult’s law • This equation assumes that most of the nonideal behavior is caused by liquid phase effects. • In the liquid phase, molecules are much more closely spaced than in the vapor phase. Therefore, attraction and repulsion among molecules have larger effects. ChE 334: Separation Processes Dr Saad Al-Shahrani
BINARY VAPOR-LIQUID EQUILIBRIUM (nonideal solution) (nonideal solution) (Ideal solution) It is useful for graphical design in determining the number of theoretical stages required for a distillation column. ChE 334: Separation Processes Dr Saad Al-Shahrani