Earth's Interior & Climate Overview: Plates, Magnetic Field, Global Warming
360 likes | 446 Vues
Explore Earth's interior layers, plate tectonics, magnetic field dynamics, and insights into climate change and global warming. Learn about seismic activity, greenhouse gases, and long-term climate variations.

Earth's Interior & Climate Overview: Plates, Magnetic Field, Global Warming
E N D
Presentation Transcript
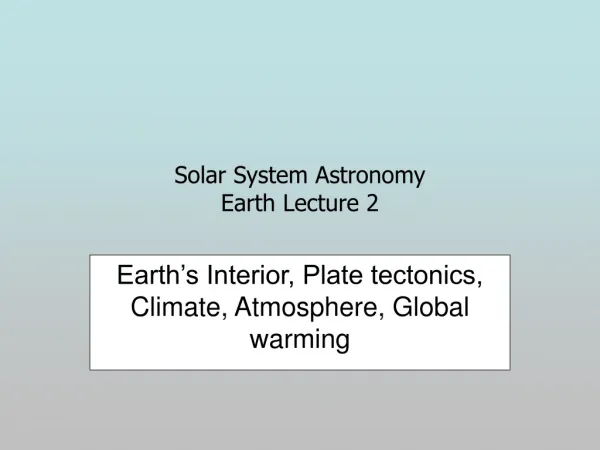
Solar System AstronomyEarth Lecture 2 Earth’s Interior, Plate tectonics, Climate, Atmosphere, Global warming
Earth’s Magnetic Field Current position of N magnetic pole
Sir John Ross (1831) first discovered N magnetic pole while exploring the Arctic. He was trapped in the polar ice for 4 years (!) and made magnetic observations to pass the time. Motion of Magnetic poles 100 km 1000 km North magnetic pole is now moving N about 15 km/yr Daily Magnetic pole motion
Aurora Solar wind electrons precipitate into polar regions, ionizing nitrogen and oxygen atoms
Continental Drift North American plate moves 50 cm per year
Movie of Continental Drift Time (Myr)
Alfred Wegener and Continental Drift: Embattled Scientist Wegener first proposed continental drift theory in 1915. It was soundly rejected, and only became accepted after his death A. Wegener (1880-1930)
San Andreas Fault The San Andreas Fault is a transform fault margin that separates the Pacific plate from the North American plate. Directions of motion are shown by the arrows. Los Angeles, on the Pacific plate, is moving north, while San Francisco is moving south, bringing the two cities closer together at a speed of 5.5 cm/y; they will be adjacent about 10 million years in the future.
Seismic Risk Map of U.S. Note: This map does not indicate frequency of earthquakes
Earth’s atmospheric gases Earth at early epochs had 500-1000x (15%-30%) CO2 than current levels (0.03%)
Ozone blocks harmful UV: skin cancers CO2 blocks IR: global warming Transmission of atmosphere versus wavelength Infrared Visible Ultraviolet
Global land temperature 1860-1997 From the late 1860s to the early 1940s, the annual mean temperature rose about 0.6 degrees C. From the early 1940s to 1965 the temperature declined about 0.2 degrees C and since 1965 the trend has been upward. The overall rise during the century and a quarter of record is ca. 0.85 degrees C. The decade of the 1990’s has been the warmest on record
Predicted global temperature increase for doubling CO2 Northern hemisphere Summer (C) Northern hemisphere Winter (C)
Model of Precipitation Changes caused by doubling CO2 concentration
Long-term global temperature variations Variations in the oxygen-isotope ratio through the Greenland Ice Sheet. The zone of strongly negative values beginning about 70,000 years ago and ending about 10,000 years represents the last glaciation. The pronounced shift in values about 10,000 years ago marks an abrupt change from glacial to interglacial climate at the end of the glaciation.
Glaciation Cycles Measured by Oxygen Isotope ratios Curve of average oxygen-isotope variations during the last 2 million years based on analyses of deep-sea sediment cores. The curve illustrates changing global ice volume during successive glacial-interglacial cycles of the Quaternary Period
Des Moines lobe North America during last glaciation (10,000 BCE)
Affect of glaciation on trees species Simplified pollen diagram prepared from data collected at Rogers Lake, Connecticut. Variations in pollen influx are plotted as a function of time, and show progressive changes in forest composition.
Greenland ice core acidity records of Volcanic eruptions Acidity record from a Greenland ice core showing peaks in sulphuric-acid precipitation attributable to major volcanic eruptions. The largest acid peak dates to 1815-1816, the time of the huge Tambora eruption in the East Indies, which produced "the year without a summer" (1816). The volcanic dust and gases in the stratosphere reduced northern hemisphere temperatures at least 0.7 degrees C.
Effects of volcanic eruptions on global temperature My. Pinatubo eruption June, 1991 (Phillipines)