Download
1 / 18
180 likes | 424 Vues
Theories of Biological Change. Linnaeus: Developed a classification system for all types of organisms based on physical attributes. Buffon: species shared ancestors and suggested Earth is older than 6,000 years

E N D
Theories of Biological Change • Linnaeus: Developed a classification system for all types of organisms based on physical attributes. • Buffon: species shared ancestors and suggested Earth is older than 6,000 years • E. Darwin: All organisms descended from a common ancestor and that more complex forms of life came from less complex forms • Lamark: All organisms evolved toward perfection and complexity that structures became larger or smaller with use of disuse
Theories of Geologic Change • Catastrophism: Natural disasters such as floods and volcanic eruptions have happened often during the Earth’s long history and these events have shaped landforms and caused species to become extinct. • Gradualism: the principle that changes observed in landforms resulted from slow changes over a period of time. • Uniformitarianism: the theory that the biologic processes that shape Earth are uniform through time.
10.2 • Variation: the difference in the physical traits of an individual from those of other individuals in the group to which it belongs. • Tortoise: example: Saddle back tortoises which have long necks and legs, live in wet areas with short plants • Finch: example: finches with strong thick beaks live in areas with a lot of large hard-shelled nuts, while finches with more delicate beaks are found where insects of fruits are widely available. • Finch adaption: a feature which allows an organism to better survive it’s environment
Fossil evidence: Glyprodon, a giant extinct armadillo that resembled living armadillos. Also fossil shells of marine organisms high up in the mountains, showing great changes that occurred in the past • Geographic evidence: Land that had been underwater was moved above sea level due to an earthquake, demonstrating that daily geologic processes can add up to a great change over a long period of time.
10.3 • Artificial selection: the process by which humans change a species by breeding it for certain traits • Heritability: the ability of a trait to be passed down from one generation to the next • Struggle for survival: Populations would grow geometrically if resources were unlimited. Instead, disease and a limited food supply keep the population smaller • Natural Selection: a mechanism by which individuals that have inherited beneficial adaptions produce more offspring on average than other individuals
10.3 • Variation: the heritable differences that exist in every population are the bases are the basis for natural selection • Over production: having many offspring increases the chance of survival but also results in competition for resources • Adaption: a certain variation that allows an individual to survive better than other individuals it competes against. • Descent with modification: Heritability of adaptions, More individuals will have the trait in every following generation, as long as the environmental conditions remain beneficial for the trait.
10.4 • Fossils: more primitive fossils are found in the lower rock layers • Geography: Island species most closely resemble species on the nearest mainland, and populations can show variations from one island to the rest. • Embryology: Crab and barnacle larvae look identical, but have very different adult body forms. Likewise, embryos‘ of vertebrates such as fish, birds, reptiles and mammals look very similiar
10.4 • Homologous structures: Features that are similar in structure but appear in different organisms and have different functions. • Vestigial Structures: Remnants or organs or structures that had a function in an early ancestor. • Analogous structures: Structures that perform a similar function but are not similar in origin.
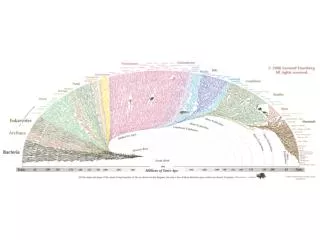
10.5 • DNA sequence analysis: the more related two organisms are, the more similar their DNA will be • Pseudogenes: no longer function but are still carried along with functional DNA, like vestigial structures, they provide evidence of a common ancestor. • Homeobox genes: control the development of specific structures. Indicate a very distant common ancestor. • Protein comparisons: Comparing proteins in cells, called molecular fingerprinting, can indicate a common ancestor.
11.1 • Genetic variation: why it’s beneficial: results in phenotypic variation which increases the liklihood that some individuals will can survive a change in the environment. • How it’s stored in the population: as alleles in a gene pool • How it’s measured: with allele frequencies; how common each allele is in each allele is in the population
11.1 • Two main sources • Mutation: a change in a DNA sequence which can form a new allele • Recombination: new allele combinations can form during meiosis, when each parents alleles are arrange in new ways in the production of gametes.
11.2 • Normal distribution: distribution in which frequency is highest new the mean value and decreases steadily towards each extreme end of the range. • A population follows the normal distribution when: that population is not under natural selection for the trait. • Graph: bell shaped curve
Microeveolution: observable change in allele frequencies of a population over time • Directional selection: favors phenotypes at one extreme of a trait’s range. Graph should show normal distribution curve shifted to the right of to the left. • Example: drug resistance in bacterial populations
Microeveolution: observable change in allele frequencies of a population over time • Stabilizing selection: favors intermediate phenotypes: graph should show narrow distrubution with peak in the middle. • Example: gall fly galls • Too big eaten • Too small attacked by wasps
Microeveolution: observable change in allele frequencies of a population over time • Disruptive selection: favors phenotypes at both extremes of a trait’s range selecting against intermediate phenotypes. Graph should show two peaks, one near each extreme phenotype with a low frequency in the middle. • Example: body color in male lazuli buntings
11.3 • Gene Flow: movement of alleles from one population to the other. • How it works: when animals move from one population to another and breed in the new population; when spores or seeds or plants or fungi are spread to new areas. • Lots of gene flow results in: genetically similar populations • Limited gene flow results in : genetically different populations that could evolve into different species