Supplementary Table 2.
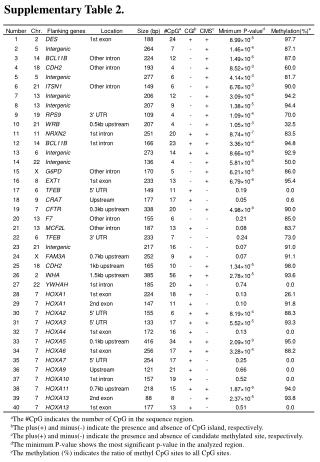
Supplementary Table 2. a The #CpG indicates the number of CpG in the sequence region. b The plus(+) and minus(-) indicate the presence and absence of CpG island, respectively. c The plus(+) and minus(-) indicate the presence and absence of candidate methylated site, respectively.

Supplementary Table 2.
E N D
Presentation Transcript
Supplementary Table 2. aThe #CpG indicates the number of CpG in the sequence region. bThe plus(+) and minus(-) indicate the presence and absence of CpG island, respectively. cThe plus(+) and minus(-) indicate the presence and absence of candidate methylated site, respectively. dThe minimum P-value shows the most significant p-value in the analyzed region. eThe methylation (%) indicates the ratio of methyl CpG sites to all CpG sites.
Supplementary Table 3. Features of candidate methylated sites are shown. aThe Obs/exp indicates the ratio of observed and expected CpG frequency. bFold-enrichment was calculated based on population of ENCODE probes extracted randomly.
Supplementary Table 4: aThe Upstream CMS shows a location of upstream CMS, if any, by a distance from a TSS. bThe 5Aza+ indicates GeneChip score with 5Aza-dC treatment. cThe 5Aza- indicates GeneChip socre without 5Aza-dC treatment.
Supplementary Figure 1: 400 200 100 50 (ng) 5Aza-dC - + Genomic DNA and demethylated DNA were spotted on a nitrocellulose membrane at 50-400ng. 1st antibody: anti-methycytosine antibody, 2nd antibody: HRP anti-rabbit IgG antibody
-5 -4 -3 -2 -1 0 0 -1 -2 -3 -4 -5 Supplementary Figure 2: A B Log 10(P) 32 16 8 4 MeDIPs vs. Controls ( n = 2 ) MeDIPs vs. Controls ( n = 2 ) MeDIP1 vs. Control1 ( n = 1 ) 2 MeDIP1 vs.. Control1 ( n = 1 ) Control1 vs. Control2 ( n = 1 ) 1 1 2 3 4 5 0 - Log10(P) The scanned tiling array data were analyzed with Tiling Array Analysis Software (Affymetrix). The p-values analyzed in those combinations of 2 MeDIPs vs. 2 Controls, MeDIP1 vs. Control1, Control1 vs. Control2 were obtained. a Number of probes less than each threshold p-value was plotted for each result. b The rates of probe numbers due to threshold p-values were plotted.
High-resolution mapping of DNA methylation in the ENCODE region. Tracks for CMS (light green bar), -10×log10(p-value) (vertical yellow bar) and CGI (green bar) are shown. a DLD1, b HCT116, b SW480
Supplementary Figure 4: A B C Bisulfite sequencing of CMS or non-CMS in HCT116. a Genomic view showing CMS on INHA (top). Tracks for sequenced region (pink bar), CMS (light green bar), -10×log10 (P-value) (vertical yellow bar) and CGI (green bar) are shown. Black horizontal bar indicates P=10-2. Result of bisulfite sequencing (bottom). Closed circle and open circle indicate methylated CpG and unmethylated CpG, respectively. bTFEB, cCRAT
Supplementary Figure 5: Results of bisulfite sequencing are shown described in Supplemental Table 3. Number 16 and 19 are shown in Supplemental Fig. 7, and number 17-18 and 26 are shown in Supplemental Fig 4. Number 28-40 are shown in Fig. 4. Closed circle and open circle indicate methylated CpG and unmethylated CpG, respectively.
Supplementary Figure 6: A DLD1_CMS DLD1_CMS DLD1_CMS DLD1_CMS
Supplementary Figure 6: B SW480_CMS SW480_CMS High-resolution mapping of DNA methylation on the HOXA cluster. Tracks for CMS (light green bar), -10×log10(p-value) (vertical yellow bar) and CGI (green bar) are shown. a DLD1, b SW480
Supplementary Figure 7: A B C Comparison of methylation patterns among three colorectal cancer cell lines. a The Venn diagram of CMS in three cell lines. If CMS overlapped at least by one base, we regard them as overlapped CMS. b and c High-resolution mapping of DNA methylation for EXT1 and CFTR, respectively. Tracks for sequenced region (blue bar). CMS and -10×log10(p-value) are shown in yellow bar for DLD1, green for HCT116, and purple for SW480. Results of sequencing are shown at the bottom.
Supplementary Figure 8: MSP analysis of genes overexpressed after 5Aza-dC treatment. a and b High-resolution mapping of DNA methylation for TKTL1 and EXT1, respectively.
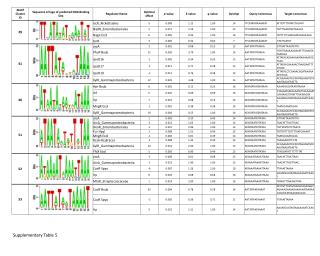
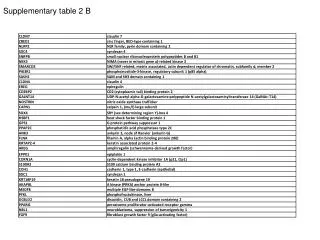
Supplementary Figure 9: SERPINB2: serpin peptidase inhibitor, clade B, member 2 TKTL1: transketolase-like 1 HCT116_CMS HCT116_CMS -10×log(P-value) -10×log(P-value) CTAG2: cancer/testis antigen 2 CTAG1B: cancer/testis antigen 1B HCT116_CMS HCT116_CMS -10×log(P-value) -10×log(P-value) PDLIM4: PDZ and LIM domain 4 CTGF: connective tissue growth factor HCT116_CMS HCT116_CMS -10×log(P-value) -10×log(P-value) EXT1: exostoses1 CDH2: N-cadherin HCT116_CMS HCT116_CMS -10×log(P-value) -10×log(P-value) AXIN1: axin 1 RFPL2: ret finger protein-like 2 HCT116_CMS HCT116_CMS -10×log(P-value) -10×log(P-value) DNA methylation maps of genes 10 top-ranking genes overexpressed after 5Aza-dC treatment are shown. Tracks for CMS (light green bar), -10×log10(p-value) (vertical yellow bar) and CGI (green bar), Repeat Masker (black bar) are shown.