Download
1 / 20
200 likes | 284 Vues
Using graphics to compress analysis. How to use simple graphics. The right chart for quantitative findings How to visualize qualitative data. The right chart form for quantitative findings.

E N D
How to use simple graphics • The right chart for quantitative findings • How to visualize qualitative data
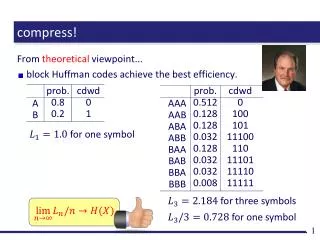
Five generic chart forms exist to represent quantitative findings. Each one is linked to a different sort of message Pie chart Bar chart • Componentcomparison • Showing the size of each part as a percentageof the whole • Comparisonof items • Showing how items rank Column chart Line chart • Development • Showing changes over time • Frequency • Showing detailed changes over time Dot chart • Correlation • Showing whether the relationship between two variables follows an expected pattern
A pie chart is typically used to show the split into components of a 100% total Guidelines Germany and France accounted for more than 50% of sales • Arrange from largest to smallest with largest at12 o'clock • Present "other" category as last component regardless of size • For clarity limit to no more than five components – the rest should be "other" Sales by region 1995 Other Germany Rest of EU Italy France 100% = € XXX mil.
The column chart is appropriate for time or component comparison Guidelines Products A and C have taken on increased importance in the sales portfolio • Arrange from largest to smallest with largest component at bottom of chart • Put "Other" category at top of chart, regardless of size • Draw dotted lines between columns to aid in making comparisons. Limit to no more than five components Sales volume breakdown per product 1993-1995 100% = € 500 M 100% = € 564 M 100% = € 580 M 20% 25% 25% Otherproducts 10% Product D 10% 25% 20% 20% Product C 10% 20% 10% Product B 40% 35% 30% Product A 1993 1994 1995
Combining pie and column charts focuses on the breakdown of one component Guidelines German sales figures indicate a strong dominance of product A • Start with pie • Turn shaded portion of pie towards column • Break pie down into column Breakdown of product sales in Germany 1995 100%=Y Unit 20% Other products 10% Product D 20% Product C Other countries 20% 80% 20% Product B 30% Product A
The basic bar chart shows an ordered list of items to be compared Guidelines Competitor 1’s sales clearly outpace those of the rest of the pack • Order to suit your needs: alphabetically, low to high or high to low • Can also use a column chart, although a column chart implies a time sequence • Preferably not more than five single items Top 5 competitors by turnover 1995– $ '000 – Competitor 1 300 Competitor 2 200 Competitor 3 150 Competitor 4 125 Competitor 5 100
Multiple bars compare two lists of items with two or more categories indicated Guidelines D’s ROS exceeded the industry average in 1994, while E’s just met the median; the reverse occurred in 1995 • Use bars instead of columns for easier labelling • Use dashed lines e.g. to show averages Return on sales top 6 competitors (%) 1994 1995 Company A Company B Company C Company D Company E Company F Average x.x% y.y% ROS= Return on Sales
Columns work well for time series with large variabilitybetween years Guidelines After a dip in 1998/99 net income became positive again in 2000 • Use a column chart to emphasize extreme variability or magnitude • Use typically with time series data • Limit to a small number of time periods Net income per year 70 60 50 40 40 20 1998 1999 1993 1994 1995 1996 1997 2000 (15) (20)
A line chart illustrates a trend or compares two or more time series Guidelines C's development has been outstrippingthat of B and A since the mid 90s • Use to emphasize movement or change • Use for a large number of time periods • Limit to three or four lines Long-term sales development US $million CAGR 30% xx C xx xx xx xx xx B xx xx A xx xx 1985 1990 1995 2000 CAGR = Combined Average Growth Rate
Correlation (or no correlation) can be shown using paired opposite bars Guidelines Discount levels, taken alone, appear tohave little bearing on units sold • Rank first set of bars from high to low or low to high • Use with relatively few sets (i.e., < 15) of data to plot Discount (%)in 2001 Unit volume sold ('000)in 2001 4 3 2 1 0 0 10 20 30 40 Company 1 Company 2 Company 3 Company 4 Company 5 Company 6 Company 7 Company 8 Company 9 Company 10 Company 11 Company 12
For more than 15 observations, correlations are usually presented in scattergrams Guidelines Most companies increase their ROS withgrowing export share • Use preferably when you have > 15 sets of data to plot • With < 15 sets of data, use a paired bar chart • If you have > 15 sets of data to plot, use a legend rather than labels • Must explain well to be effective Profitability vs. export share 1993 ROS (%) B A = Company X B = Company Y C = Company Z … C A 10 20 30 40 50 60 70 80 90 100 Export share (%) ROS= Return on Sales
A correlation chart may also be used to indicate clusters Guidelines All products show room for improvement • Use for weak correlations to cluster and indicate need for action • Avoid overloading the matrix to keep the message clear Profit per piece vs. volume 1995 Profit per Piece (€) A Increase volume High profit A = Product X B = Product Y … Increase margin B Low profit Low volume High volume Number of units sold
A sequence from left to right is typically used to illustrate flows Guidelines Phase 1 break down into three steps • Use typically to show time stages • Can be subdivided to show sub-stages • Below each stage, characteristic action to be taken or other relevant items should be added (not more than five) Phase 1 Phase 2 Phase 3 Phase 4 Step 1A Step 1B Step 1C • Bullet point 1 • Bullet point 2 • Bullet point 3 • Bullet point 4 • Bullet point 1 • Bullet point 2 • Bullet point 3 • Bullet point 1 • Bullet point 2 • Bullet point 3 • Bullet point 4
Hierarchies are usually represented in an organization chart Guidelines A typical organizational chart • Limit to three or four layers • Use dotted lines to show informal relationships • Break down departments on separate charts Name/Position Name Name/Position Name/Position Name/Position Name/Position Name/Position Name/Position Name/Position Name/Position
Drivers and their consequence are usually linked with an arrow Guidelines Four drivers influence the cost position of XX • Arrow can be horizontal or vertical • Drivers can be put into frames or also into a bullet point format (for horizontal arrows only) • Not more than five drivers • The consequence always set apart in a separate frame Driver 2 Driver 3 Driver 1 Driver 4 Consequence
Scales are an excellent symbol to illustrate trade-offs Guidelines There are obviously more argumentin favor of alternative 2 • Use only for clear trade-offs between two distinct alternatives • Have more arguments in favor of your favorite alternative Alter-native 1 • Con argument 1 • Con argument 2 Alter-native 2 • Pro argument 1 • Pro argument 2 • Pro argument 3
Whole concepts and framework/tools are often identified with a unique visual Guidelines • Always apply concept visuals in the correct context • Avoid adding too many details to the visual if not needed, otherwise transfer part of it to next visuals Business System ROCE Tree Skill Analysis ROCE = Return on Capital Employed