Download
1 / 1
10 likes | 123 Vues
Evolutionary Characteristics of Magnetic Helicity Injection in Active Regions Hyewon Jeong and Jongchul Chae Seoul National University, Korea.

E N D
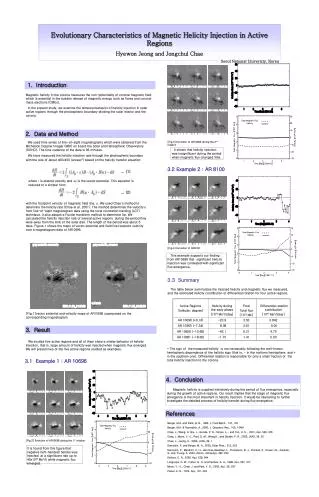
Evolutionary Characteristics of Magnetic Helicity Injection in Active Regions Hyewon Jeong and Jongchul Chae Seoul National University, Korea Magnetic helicity in the corona measures the non-potentiality of coronal magnetic field which is essential in the sudden release of magnetic energy such as flares and coronal mass ejections (CMEs). In the present study, we examine the temporal behavior of helicity injection in solar active regions through the photospheric boundary dividing the solar interior and the corona. 1. Introduction 2. Data and Method We used time series of line-of-sight magnetograms which were obtained from the Michelson Doppler Imager (MDI) on board the Solar and Heliospheric Observatory (SOHO). The time cadence of the data is 96 minutes. We have measured the helicity injection rate through the photospheric boundary with the size of about 400x400 (arcsec2) based on the helicity transfer equation [Fig.3] Evolution of AR10696 during the 2nd rotation It shows that helicity injection was insignificant during the period when magnetic flux changed little. 3.2 Example 2 : AR 8100 … (1) where vis plasma velocity and Ap is the vector potential. This equation is reduced to a simpler form … (2) with the footpoint velocity of magnetic field line, u. We used Chae’s method to determine the helicity rate (Chae et al. 2001). The method determines the velocity u from line-of-sight magnetogram data using the local correlation tracking (LCT) technique. It also adopts a Fourier transform method to determine Ap. We calculated the helicity injection rate of several active regions during the period they were away from the limb of the solar disk. The length of the period was about 5 days. Figure 1 shows the maps of vector potential and field line footpoint velocity over a magnetogram data of AR10696. [Fig.4] Evolution of AR8100 This example supports our finding from AR10696 that significant helicity injection was correlated with significant flux emergence. 3.3 Summary The table below summarizes the injected helicity and magnetic flux we measured, and the estimated helicity contribution of differential rotation for four active regions. [Fig.1]vector potential and velocity maps of AR10696 superposed on the corresponding magnetogram 3. Result We studied five active regions and all of them show a similar behavior of helicity injection, that is, large amount of helicity was injected when magnetic flux emerged. We will present two of the five active regions studied as examples. • The sign of the measured helicity is not necessarily following the well-known hemispheric dependence of the helicity sign (that is, - in the northern hemisphere, and + in the southern one). Differential rotation is responsible for only a small fraction of the total helicity injection to the corona. 3.1 Example 1 : AR 10696 4. Conclusion Magnetic helicity is supplied intensively during the period of flux emergence, especially during the growth of active regions. Our result implies that the stage of magnetic flux emergence is the most important in helicity injection. It would be interesting to further investigate the detailed process of helicity transfer during flux emergence. References Berger, M.A. and Field, G. B., 1984, J. Fluid Mech., 147, 133 Berger, M.A. & Ruzmaikin, A., 2000, J. Geophys. Res., 105, 10481 Chae, J., Wang, H. Qiu, J., Goode, P. R., Strous, L.., and Yun, H. S. , 2001, ApJ, 560, 476 Chae, J.,Moon, Y.-J., Rust, D. M., Wang,H., and Goode, P. R., 2003, JKAS, 36, 33 Chae, J., Jeong, H., 2005, JKAS, 39, 1 Demoulin, P. and Berger, M. A., 2003, Solar Phys., 215, 203 Demoulin, P., Mandrini, C. H., van Driel-Gesztelyi, L. ,Thompson, B. J., Plunkett, S., Kovari, Zs., Aulanier, G. and Young, A. 2002, Astron. Astrophys, 382, 650 DeVore, C. R., 2000, ApJ, 539, 944 Longcope, D. W., Fisher, G. H. and Pevtsov, A. A., 1998, ApJ, 507, 417 Moon, Y. –J., Chae, J. and Park, Y. D., 2003, ApJ, 36, S37 Parker, E. N., 1974, ApJ, 191, 245 [Fig.2] Evolution of AR10696 during the 1st rotation It is found from this figure that negative (left-handed) helicity was injected at a significant rate up to 40x1040 Mx2/h while magnetic flux emerged.