And here comes our pTout:
10 likes | 171 Vues
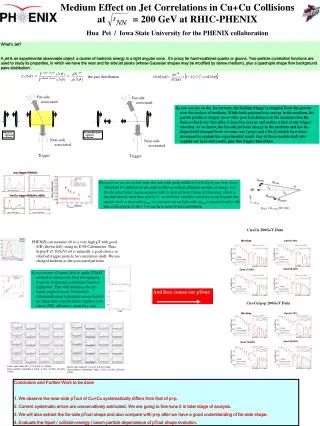
Cu+Cu, trigger 5-10GeV/c, 0-20%. p+p, trigger 5-10GeV/c. Min-Bias. Min-Bias. Cent 0-10%. Cent 0-10%. Cent 20-40%. Cent 20-40%. Cent 10-20%. Cent 10-20%. Left to right: Asso pT 1-2, 2-3, 3-5, 5-10 GeV Top to bottom: Centrality 0-100%, 0-10%, 10-20%, 20-40%, 0-20%.

And here comes our pTout:
E N D
Presentation Transcript
Cu+Cu, trigger 5-10GeV/c, 0-20% p+p, trigger 5-10GeV/c Min-Bias Min-Bias Cent 0-10% Cent 0-10% Cent 20-40% Cent 20-40% Cent 10-20% Cent 10-20% Left to right: Asso pT 1-2, 2-3, 3-5, 5-10 GeV Top to bottom: Centrality 0-100%, 0-10%, 10-20%, 20-40%, 0-20% Left to right: Asso pT 1-2, 2-3, 3-5, 5-10 GeV Top to bottom: Centrality 0-100%, 0-10%, 10-20%, 20-40%, 0-20% Far-side associated Far-side associated D f Same Event AB Y ( ) dN D f µ µ C ( ) the pair distribution D f D f Mixed Event Y ( ) d ( ) As you can see on the Jet-cartoon, the leading trigger is sampled from the parton near the surface of medium. While both partons loses energy in the medium, the parton produces trigger (near-side) goes less distance in the medium than the back-to-back one (far-side), it loses less energy and makes a bias of our trigger selection. As we know, the far-side jet loses energy in the medium and has its shape/yield changed from vacuum case (p+p), and a lot of models have been developed to explain the experimental result. Any of these models shall also explain our near-side result, plus this trigger-bias effect. Proton/deuteron nucleus collision Nucleus- nucleus collision Near-side associated Near-side associated Trigger Trigger Cu+Cu 200GeV Data PHENIX can measure p0 to a very high pT with good S/B (shown left), using its E-M-Calorimeter. Thus, high pT (5-10GeV) p0 is naturally a good choice as idenfied trigger particle for correlation study. We use charged hadrons as the associated particles. So we use the v2 input (left) to apply ZYAM method to subtract the flow background from our foregound correlation-function (right-top). That will remain us the jet-signal (right-bottom). Meanwhile, v2/normalization systematic errors (below) are taken into consideration, together with others (PID, efficiency, centrality, etc). Cu+Cu/p+p 200GeV Data Medium Effect on Jet Correlations in Cu+Cu Collisions at = 200 GeV at RHIC-PHENIX Hua Pei / Iowa State University for the PHENIX collaboration What’s Jet? A jet is an experimental observable object: a cluster of hadronic energy in a tight angular cone. It’s proxy for hard-scattered quarks or gluons. Two-particle correlation functions are used to study its properties, in which we have the near and far side jet peaks (whose Gaussian shapes may be modified by dense medium), plus a quadruple shape flow background pairs distribution: However, as we see on left-side, the near-side peak-width of Cu+Cu/p+p are very close. Therefore it’s difficult to use peak-width to evaluate different models of energy loss. On the other hand, because peak-width is derived from fitting of Gaussian, which is decided mostly from bins nearby 0 , we look for variables sensitive to Df beyond this region, such as near-side pTout. As you can see on right-side, pTout is proportional to Df, thus even region of Df > 3-s can have non-trivial contribution. pTout = pT,assoc sin (Df) And here comes our pTout: • Conclusion and Further Work to be done • We observe the near-side pTout of Cu+Cu systematically differs from that of p+p. • Current systematic errors are conservatively estimated. We are going to fine-tune it in later stage of analysis. • We will also extract the far-side pTout shape and also compare with p+p after we have a good understanding of far-side shape. • Evaluate the Npart / collision-energy / beam-particle dependence of pTout shape evolution.