Consolidating Software Tools for DNA Microarray Design and Manufacturing
This document presents an overview of software tools used in the design and manufacturing of DNA microarrays. It addresses key aspects such as genome ID reading, probe selection, array physical design, and hybridization experiments. By utilizing the DNA Array Flow (DAF) methodology, the study benchmarks experiments with Herpes B virus and discusses future work in understanding gene activity across different conditions. The motivation behind microarrays is highlighted, emphasizing their significance in exploring gene expression regulation and cellular dynamics.


Consolidating Software Tools for DNA Microarray Design and Manufacturing
E N D
Presentation Transcript
Consolidating Software Tools for DNA Microarray Design and Manufacturing Mourad Atlas Nisar Hundewale Ludmila Perelygina Alex Zelikovsky
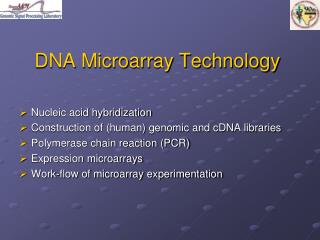
Agenda Introduction DNA Array Flow (DAF) Benchmarks: Herpes B virus Experiments and Results Conclusion and Future Work
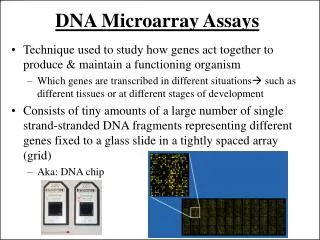
Motivation • Microarrays provide a tool for answering a wide variety of questions about the dynamics of cells: • In which cells is each gene active? • Under what environmental conditions is each gene active? • How does the activity level of a gene change under different conditions? • Stage of a cell cycle? • Environmental conditions? • Diseases? • What genes seem to be regulated together?
Genome ID Reading genomic data Probe selection Physical design Mask and array manufacturing Hybridization experiment Analysis of hybridization intensities DNA Array Flow • Downloading genome sequence and extracting ORFs in FASTA format • For each gene G, find probes that hybridize to G at a given TM but do not hybridize to any other gene at that TM • Probe placement: determine for each probe a site on the array 2-D surface for it to be placed or synthesized. Probe embeddings: which embeds each probe into the deposition sequence • Photolithographic process used in sequence masking • Each probe bindsto its target using the complementary rules. • can be measured by a laser scanner and converted to a quantitative value that can be read
Genome ID Reading genomic data Probe selection Physical design Mask and array manufacturing Hybridization experiment Analysis of hybridization intensities Reading genomic data
Input the genome ID Download genome sequence Genome ID Downloading genome sequence from GenBank Bioperl ORF Extraction from genome GeneMark (Bordovsky GaTech) Or: ORF Finder Extracting Extra ORFs: ( ) ORF Parser: ORFs in FASTA format Probe selection Reading Genomic Data
Genome ID Downloading genome sequence from GenBank Bioperl ORF Extraction from genome GeneMark (Bordovsky GaTech) Or: ORF Finder Extracting Extra ORFs: ( ) ORF Parser ORF Parser: ORFs in FASTA format Probe selection ORF Extraction
What is ORF? • Open reading frame (ORF) is a subsequence of DNA that could potentially be transcribed into messenger RNA (mRNA) • Because of the differences between prokaryotic and eukaryotic transcription systems there are two types of ORF: • Prokaryotes: start and stop codon • Eukaryotic: stop codon
ORF Parser Genome ID Downloading genome sequence from GenBank Bioperl ORF Extraction from genome GeneMark (Bordovsky GaTech) Or: ORF Finder Extracting Extra ORF: ( ) ORF Parser ORFs in FASTA format Probe selection
Genome ID Reading genomic data Probe selection Physical design Mask and array manufacturing Hybridization experiment Analysis of hybridization intensities DNA Array Flow
Reading genomic data ORF preprocessing Promide Choosing best melting temperature Ocand :find all candidate for given temperature Pools of probes Physical design Probe Selection
Probe Selection Requirements • Homogeneity: • Ensure that the probes can bind to its target at the temperature of the experiment • Sensitivity: • Avoid self-hybridization: ensure that the probes will not form a secondary structure. (Such a structure will prevent the probes from binding to its target) • Specificity: • – the probes stay unique even after a few bases are changed • – Probe must hybridize to one particular gene: For each gene G, find probes that: • hybridize to G at a given temperature • do not hybridize to any other gene at that Temperature • – Avoid cross-hybridization
Possible solutions: Li and Stormo 2001 Kaderali and Schliep 2002 Rahmann (Promide) 2003 They use the same data structure: Suffix array Promide handles truly large scale datasets in a reasonable amount of time Human GeneNest clusters: in 50 hours Neurospora Crassa: Promide: few hours Li and Stormo: 1 week Why Promide?
ORF preprocessing Classes of Sequences: • A Master sequence is a sequence we wish to design oligos for. • A Background sequence is a sequence against which specificity is checked. • Every Master is also a Background
Choosing best melting temperature • For each candidate oligo (substring) of a Master, do: – Check side constraints – Compute specificity: Optimal TM- alignment with every Background collection • Compute Matching Statistics: mims • Oligos Candidate Selection: ocand
Genome ID Reading genomic data Probe selection Physical design Mask and array manufacturing Hybridization experiment Analysis of hybridization intensities Mask and array manufacturing
Selectively expose array sites to light arrays are synthesized to a wafer Flush chip’s surface with solution of protected A, C, G, T Repeat last two steps until desired probes are synthesized Mask and Array manufacturing
A Mask 1 A A A A A Mask and Array manufacturing A 3×3 array CG AC G AC ACG AG AG C CG Nucleotide Deposition Sequence ACG array probes
C Mask 2 A C C A A C A C A C C Array manufacturing A 3×3 array CG AC G AC ACG AG AG C CG Nucleotide Deposition Sequence ACG array probes
G Mask 3 A Nucleotide DepositionSequence defines the order of nucleotide deposition A Probe Embedding specifies the steps it uses in the nucleotide sequence to get synthesized A C G G C A A C A G C G A C G G C Array manufacturing A 3×3 array CG AC G AC ACG AG AG C CG Nucleotide Deposition Sequence ACG array probes
A Mask 1 Border Reduction Border = 8 Unwanted illumination Chip’s yield A A A A A BorderMinimizationChallenges A 3×3 array CG AC G AC ACG AG AG C CG Nucleotide Deposition Sequence ACG array probes
Problem: Diffraction, internal reflection, scattering, internal illumination Occurs at sites near to intentionally exposed sites Lamp Mask Reduce Border Increase yield Reduce cost Design objective: Minimize the border Array Border Minimization Challenges Intentionally exposed sites Border Unwanted illumination
Genome ID Reading genomic data Probe selection Physical design Mask and array manufacturing Hybridization experiment Analysis of hybridization intensities Physical design
Probe Selection Deposition sequence design Test control 2D-probe placement 3D-probe embedding Mask and array manufacturing Physical Design
Physical Design • Probe Placement • Similar probes should be placed close together • Constructive placement • Placement improvement operators • Probe Embedding • Degrees of freedom (DOF) in probe embedding • DOF exploitation for border conflict reduction
T T Optimize A T C C T A T C T C Border = 4 Border Reduction with Probe Placement Probe Placement • Similar probes should be placed close together T T T G C A A Deposition Sequence T T G C C C A A T T Probes T C C Border = 8
Border Reduction in Probe Embedding Probe Embedding T T G C A A A Deposition Sequence T T T T G Border = 4 Border = 2 C C C A A T Probes A T T C T C Synchronous embedding: deposit one nucleotide in each group of “ACGT” Asynchronous embedding: no restriction
Physical Design Problem Give:n2 probes Find: Placement of probes in n x n sites Embedding of the probes Minimize: Total border cost
H G2 site probe Problem formulation for placement • 2-dim (synchronous) Array Design Problem: • Minimize placement cost of Hamming graph H • (vertices=probes, distance = Hamming) Hamming Distance (P1, P2) = number of nucleotides which are different from its counterpart= border (synchronous embedding) • on 2-dim grid graph G2 (N x N array, edges b/w neighbors)
1 2 3 25 A A A A C C A A A A T T A A A A T T A A T T T T G G C C G G C C C C G G G G G G Placement Objective: Minimize Border Sorting the probes order reduces discrepancies between adjacent probes 1 2 3 25 Probe 1 Probe 2 Probe 3 Probe 5 Probe 4 Sort the probes in lexicographical order Problem: How to place the 1-D ordering of probes onto the 2-D chip?
TSP+1-Threading Placement • Hubbel 90’s • Find TSP tour/path over given probes with Hamming distance • Place in the grid following TSP • Adjacent probes are similar • Hannenhalli,Hubbel,Lipshutz, Pevzner’02: • Place the probes according to 1-Threading • further decreases total border by 20%
A A C A A T A A T A T T G C G C C G G G Placement By Threading 1 2 3 25 2 3 Probe 1 Probe 2 5 4 1 Probe 3 Probe 4 Probe 5 Thread on the chip
Row-Epitaxial Placement Improvement (i, j) Switch For each site position (i, j): Move the best probe to (i, j) and lock it in this position Find the best probe which minimize border Row placement = sort + thread + row epitaxial
T G G G C A T T G G C A T T T G C C C C A Synchronous Embedding Asynchronous Embedding Another Embedding Probe Embedding G Group T C Deposition Sequence Hypothetical Probe
A A G T A A G G G T T T G G G A A Synchronous Embedding ASAP Embedding Embedding Determines BorderConflicts G T C A G T C Deposition Sequence A G T Probes C A A A G G T T T G C G A A
Problem formulation • 2-dim (synchronous) Array Design Problem: • Minimize placement cost of Hamming graph H • (vertices=probes, distance = Hamming) • on 2-dim grid graph G2 (N x N array, edges b/w neighbors) • 3-dim (asynchronous) Array Design Problem: • Minimize cost of placement and embedding of Hamming graph H’ • (vertices=probes, distance = Hamming b/w embedded probes) • on 2-dim grid graph G2 (N x N array, edges b/w neighbors)
Post-placement Optimization Methods • Asynchronous re-embedding after 2-dim placement • Greedy Algorithm • While there exist probes to re-embed with gain • Optimally re-embed the probe with the largest gain • Batched greedy: speed-up by avoiding recalculations • Chessboard Algorithm • While there there is gain • Re-embed probes in red sites • Re-embed probes in green sites
Genome ID Reading genomic data Probe selection Physical design Mask and array manufacturing Hybridization experiment Analysis of hybridization intensities Analysis of hybridization intensities
Experimental Study • In our experiment we have considered the following parameters and we measured the results for different values of these parameters. • Melting Temperature: • We choose the temperatures 60C and 65C as best melting temperatures for our DNA probe array. • Number of Candidates: • We experimented with different values of K (number of candidates) for each pools of probes: 1 and 2. • Chip Size: • We ran our Experiments with 2 different chip sizes. We experimented with 50x50 and 60x60. • We give the number of conflict and runtime for each algorithm for the Herpes B virus and simulated data
Genome ID Bioperl Sequence in FASTA format GenMark ORF Extraction Pools of probes in Chip format Placements: TSP Select Probes: Pool pf Probes Read Pool/ Genpool ORF in Fasta format ORF Parser Promide Probe Parser # of Conflicts-CPU Time for all Algorithms Placements: Sorting Chip Placements: Row placement Embedding: Chessboard Experiments Outline
Conclusion and Future work • Conclusion: • Our experiments show: • The genomic data follow the pattern predicted by simulated data • In case of Herpes B virus, like simulated data, increasing number of candidates per probe (k) decreases number of border conflicts during the probe placement algorithms • The number of border conflicts is several times smaller than for simulated data • The trade-off between number of border conflicts and the CPU time taken for the various algorithms that are defined in the physical design • We give a concatenate software solution for the entire DNA array flow • We explore all steps in a single automated software suite of tools • Future work: • The entire software suite be made available through web services • Users can enter name of organism or ID and with an option of choosing to set the required parameters the suite will produce the DNA probe micro-array chip layout