Download
1 / 60
600 likes | 618 Vues
This paper explores the importance of spectral analysis in sampling for assessing the bias and variance in numerical integration. It discusses various strategies to improve estimators and presents a comparison between two sampling strategies. The paper derives estimator bias and variance in closed form and highlights the significance of sampling spectrum's phase.

E N D
Fourier Analysis of Stochastic Sampling For Assessing Bias and Variance in Integration KarticSubr, Jan KautzUniversity College London
assessing quality: eg. rendering Shiny ball in motion Shiny ball, out of focus … pixel multi-dim integral
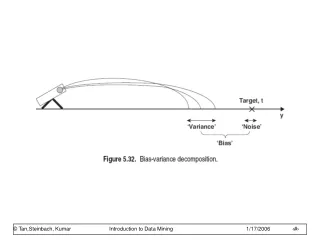
variance and bias High variance High bias
bias and variance predict as a function of sampling strategy and integrand High variance High bias
variance-bias trade-off High variance High bias analysis is non-trivial
numerical integration implies sampling (N samples) sampled integrand 0
numerical integration implies sampling sampled integrand 0
the sampling function integrand sampled integrand sampling function multiply
sampling func. decides integration quality integrand sampled function sampling function multiply
strategies to improve estimators 1. modify weights eg. quadrature rules
strategies to improve estimators 2. modify locations 1. modify weights eg. importance sampling eg. quadrature rules
abstract away strategy: use Fourier domain 2. modify locations 1. modify weights analyse sampling function in Fourier domain eg. quadrature rules
abstract away strategy: use Fourier domain 2. modify locations 1. modify weights sampling function in the Fourier domain amplitude (sampling spectrum) a. Distribution eg. importance sampling) eg. quadrature rules frequency phase (sampling spectrum)
stochastic sampling & instances of spectra Instances of sampling functions Instances of sampling spectra Sampler (Strategy 1) draw Fourier transform
assessing estimators using sampling spectra Instances of sampling functions Instances of sampling spectra Sampler (Strategy 1) Which strategy is better? Metric? Sampler (Strategy 2)
accuracy (bias) and precision (variance) Estimator 2 has lower bias but higher variance reference frequency Estimator 1 Estimator 2 estimated value (bins)
related work Monte Carlo rendering Monte Carlo sampling spectral analysis of integration signal processing assessing sampling patterns
stochastic jitter: undesirable but unavoidable Jitter [Balakrishnan1962] Point processes [Bartlett 1964] Impulse processes [Leneman 1966] Shot noise [Bremaud et al. 2003] signal processing
we assess based on estimator bias and variance Point statistics [Ripley 1977] Frequency analysis [Dippe&Wold 85, Cook 86, Mitchell 91] Discrepancy [Shirley 91] Statistical hypotheses [Subr&Arvo 2007] Others [Wei&Wang 11,Oztireli&Gross 12] assessing sampling patterns
recent and most relevant spectral analysis of integration numerical integration schemes [Luchini 1994; Durand 2011] errors in visibility integration [Ramamoorthi et al. 12]
recent and most relevant we derive estimator bias and variance in closed form we consider sampling spectrum’s phase spectral analysis of integration numerical integration schemes [Luchini 1994; Durand 2011] errors in visibility integration [Ramamoorthi et al. 12]
Intuition (now) Formalism (paper)
Review: in the Fourier domain … Fourier transform Dirac delta Frequency Imaginary amplitude phase Real primal Fourier Complex plane
Review: in the Fourier domain … Fourier transform Dirac delta Frequency Imaginary Imaginary Real Real primal Fourier Complex plane Complex plane
amplitude spectrum is not flat Fourier transform = = + + + + + + primal Fourier
sample contributions at a given frequency 1 2 3 4 5 At a given frequency sampling function Imaginary 3 5 Real 1 4 2 Complex plane
the sampling spectrum at a given frequency sampling spectrum Complex plane given frequency 3 centroid 5 1 4 2
the sampling spectrum at a given frequency sampling spectrum instances centroid variance expected centroid given frequency
expected sampling spectrum and variance expected amplitude of sampling spectrum variance of sampling spectrum DC frequency
intuition: sampling spectrum’s phase is key • without it, expected amplitude = 1! • for unweighted samples, regardless of distribution • cannot expect to know integrand’s phase • amplitude + phase implies we know integrand!
Result 1: estimator bias sampling spectrum integrand’s spectrum bias f S Implications S non zero only at 0 freq. (pure DC) => unbiased estimator <S> complementary to f keeps bias low What about phase? reference frequency variable inner product
expanded expression for bias amplitude bias f S f S phase reference
omitting phase for conservative bias prediction amplitude bias f S f S phase reference
new measure: ampl of expected sampling spectrum periodogram ours
Result 2: estimator variance sampling spectrum integrand’s power spectrum || f ||2 variance S frequency variable inner product
the equations say … • Keep energy low at frequencies in sampling spectrum • Where integrand has high energy
1D Gaussian jitter jitter using iid Gaussian distributed 1D random variables samples
1D Gaussian jitter in the Fourier domain Imaginary Complex plane Fourier transformed samples at an arbitrary frequency centroid Jitter in position manifests as phase jitter real
derived Gaussian jitter properties • any starting configuration • does not introduce bias • variance-bias tradeoff
Testing integration using Gaussian jitter random points binary function p/w constant function p/w linear function