Download
1 / 19
200 likes | 363 Vues
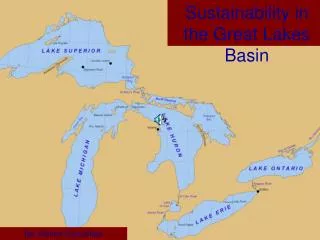
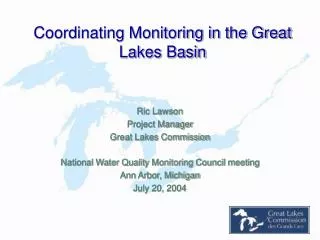
Indicators of Persistent Toxic Substances in the Great Lakes Basin. Jon Dettling Great Lakes Commission PBT Reduction Team – Great Lakes Regional Collaboration Maumee Bay, Ohio 22 February 2005. Why Use Indicators?. Assess trends Evaluate progress toward goals

E N D
Indicators of Persistent Toxic Substances in the Great Lakes Basin Jon Dettling Great Lakes Commission PBT Reduction Team – Great Lakes Regional Collaboration Maumee Bay, Ohio 22 February 2005
Why Use Indicators? • Assess trends • Evaluate progress toward goals • Evaluate existing programs, policies and regulations • Develop new programs, policies and regulations • Understand existing problems • Understand relationship of actions to impacts • Prioritize research, data collection, monitoring and remediation
Indicators must be . . . • Quantifiable 2) Able to be measured consistently across time and geography 3) Adequately reflect the state of the environment with regard to the impacts in question
Resolution: Indicators must have adequate resolution in: • Space • Time • Chemicals assessed
Indicator Categories • Concentrations in environmental compartments, biota and humans • Emissions, loadings and out-of-basin transport • Human and wildlife health impacts and biological markers • Institutional or societal response actions
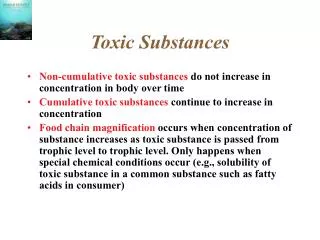
Concentrations in Environmental Compartments, Biota and Humans Concentrations in: • Great Lakes water • Inland waters • Sediments • Soils • Air • Phytoplankton, algae and microorganisms • Invertebrates • Forage fish • Piscivorous fish, birds, and mammals • Terrestrial plants and animals • Humans
Emissions, Loadings and Out-of-Basin Transport • Allow assessment of near-term and long-term future trends • Allow determination of mass balances and recovery trajectories • Allow evaluation of future loading scenarios • Support management decisions
Emissions, Loadings and Out-of-Basin Transport • Emissions to water • Emissions to air • Emissions to soil • Atmospheric deposition (dry, wet and gaseous) • Tributary inputs • Recovery trajectory • Contribution of long-range transport
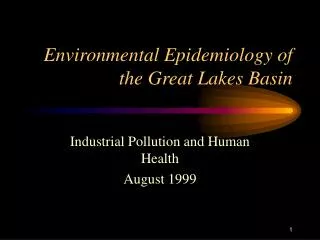
Human and Wildlife Health Impacts and Biological Markers Indicators of impacts can be: • Predicted; or • Observed Impact indicators allow comparisons across chemicals and over time. Biological markers can track organismal or physiological responses to “the total environment”
Human and Wildlife Health Impacts and Biological Markers • Predicted impacts on: • Microorganisms • Invertebrates • Forage fish • Piscivorous fish, birds, mammals • Humans • Sediment toxicity by laboratory test • Estrogenic / androgenic activity of sediments • Additional biological markers
Institutional or Societal Response Actions Track what we are doing to respond to the problem: • Energy use • Transportation use • Industrial “eco-efficiency” • Pesticide use • Regulatory implementation • Cleanup programs • . . .
Relationship of Indicators Easy to track actions Difficult to link to impacts Easy to track impacts Difficult to link to actions Indicator Actions Indicator Emissions Indicator Loadings Indicator Environmental Concentrations Uptake & Accumulation Indicator Biotic Concentrations Indicator Cellular / Physiological Response Indicator Organism / Population Impact
SOLEC Indicators • State of the Lakes Ecosystem Conference held biennially, with reports in intervening years • Nearly 100 indicators are included on the current list • Many relate to PTS
Great Lakes Environmental Indicators (GLEI) • Large project, coordinated by NRRI and involving many partner organizations • Currently developing 2 PTS indicators: • Photo-induced PAH toxicity in larval fish • Estrogen induction in male fish
Monitoring, Modeling and Information Management • New indicators will often require additional monitoring and data collection • Modeling could be used in many cases to fill some gaps • Information management
Data Quality Our indicators will only be as accurate as our monitoring, modeling and data collection From: Nisbet, I. C. T. Environmental Monitoring and Assessment. 1998, 53, 3-15.