Download
1 / 27
270 likes | 411 Vues
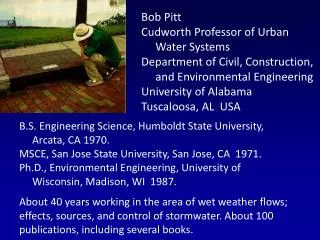
Bob Pitt Cudworth Professor of Urban Water Systems Department of Civil, Construction, and Environmental Engineering University of Alabama Tuscaloosa, AL USA. B.S. Engineering Science, Humboldt State University, Arcata, CA 1970.

E N D
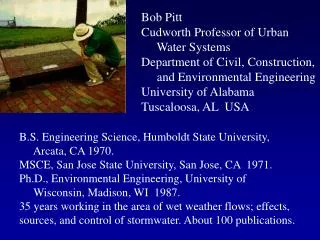
Bob Pitt Cudworth Professor of Urban Water Systems Department of Civil, Construction, and Environmental Engineering University of Alabama Tuscaloosa, AL USA B.S. Engineering Science, Humboldt State University, Arcata, CA 1970. MSCE, San Jose State University, San Jose, CA 1971. Ph.D., Environmental Engineering, University of Wisconsin, Madison, WI 1987. About 40 years working in the area of wet weather flows; effects, sources, and control of stormwater. About 100 publications, including several books.
Simple Hydrograph Shapes for Urban Stormwater Water Quality Continuous Analyses Robert Pitt, Ph.D., P.E., D.WRE, BCEE Department of Civil, Construction, and Environmental Engineering University of Alabama Tuscaloosa, AL, USA 35487 John Voorhees, P.E., P.H. AECOM, Inc. Madison, WI
Presentation Topics • Observed Urban Area Hydrographs • Modeling Hydrographs in Urban Areas • Calculated WinTR-55 Hydrographs • Hydrograph Characteristics used in WinSLAMM • Analyses of Observed Urban Hydrograph Shapes
Observed Urban Hydrographs Evaluated about 550 different urban area hydrographs from 8 watersheds (1, 1a, 2, and 3 rain distributions and B soils to pavement)
Typical plot of calculated curve numbers for actual site monitoring. This date is from the Univ. of Florida’s rainfall-runoff database that contains historical SCS and COE monitoring data that was used to develop TR-55. Obviously, the CN method is only applicable for the large drainage design storms for which it was intended!
This type of plot, with very high curve number values for small events and more “reasonable” values with large events, is consistent with all monitoring locations. This is another example showing several of these plots for monitoring locations at high density residential areas from some of the EPA’s NURP projects (1983). The effect is most extreme for areas having less impervious cover. This is solely an effect of the algebraic simplifications of the CN method (mostly due to the Ia/S = 0.2 assumption) which is reasonable for drainage design storms, but not for smaller events. “Average” or best-fit outfall conditions are usually used to calibrate models, resulting in reasonable long-term calculations, but with significant errors when determining the sources (and control benefits) in the watershed area. Pitt, et al. 2002
To Large and Intense (Hurricane Katrina): up to 3.5 in/hr peak rain intensity 3.2 inches total depth in 16 hrs
SWMM 5 Unit hydrographs and aggregate storm hydrograph (Bend, OR, 2008) Examples of excellent calibrations with local data
NRCS Dimensionless Unit Hydrograph and Triangular Hydrograph
Bellevue, WA, Surrey Downs, medium density residential area, 1 inch rain, TR55CN 81 and observed 87
Tuscaloosa, AL, BamaBelle, landscaped parking area, 1 inch rain, TR55CN 92 and observed 98
WinSLAMM Complex Triangular Storm Hydrograph Peak to average flow ratio of 3.8 Runoff to rain duration ratio of 1.2 0.25 inch runoff and 1 acre
Observed Peak to Average Flow Ratios(non-parametric Kruskal-Wallis one way ANOVA on ranks)
Peak to Average Runoff Rate Ratios The variation in each rain/land use group can be described using a Monte Carlo stochastic modeling approach for long-tem continuous simulations.
Observed Runoff to Rain Duration Ratios(non-parametric Kruskal-Wallis one way ANOVA on ranks)
Runoff to Rain Duration Ratios Again, the variation in each land use group can be described using a Monte Carlo stochastic modeling approach for long-tem continuous simulations.
WinSLAMM Flow-Duration Analyses for Examining Different Control Scenarios
Flow-Duration Curves for Different Stormwater Conservation Design Practices
Conclusions • Uncalibrated, or partially calibrated runoff models (such as only for annual runoff volume) likely greatly distort the actual hydrograph shapes in urban areas, especially for small to moderate-sized events. • Smaller events are under-represented and larger events are over-predicted to balance long-term flows. • Greatly affects flow-duration analyses for habitat assessment.
Conclusions • Simple models cannot match the hydrograph shape and commonly use the same mechanisms for all rains. • More complex models can be appropriately calibrated to represent a wide range of rains and watershed conditions. • However, if uncalibrated (and use “traditional” model parameters representative of drainage design), even these better models will distort the flow-duration relationship (usually by greatly over-predicting the peak to average runoff ratio, especially for the smaller rains).
Conclusions • WinSLAMM uses a complex triangular storm hydrograph that can be modified based on relatively simple data evaluations (peak to average flow ratio, runoff to rain duration ratio, and storm runoff volume). • This flexibility allows a good match to observed conditions for the storms of most interest in water quality and habitat evaluations. • Planned model improvements will include stochastic elements to better describe remaining variability.