Earl Duncan
310 likes | 336 Vues
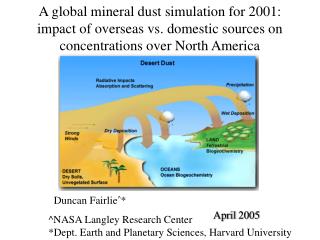
The Australian Cancer Atlas: mapping reliable small-area estimates of cancer incidence and survival. Earl Duncan. GeoMed `19, Glasgow 28 Aug 2019. Overview Technical Details Visualisations Results Future Work. Objectives of the Australian Cancer Atlas (ACA):

Earl Duncan
E N D
Presentation Transcript
The Australian Cancer Atlas: mapping reliable small-area estimates of cancer incidence and survival. Earl Duncan GeoMed `19, Glasgow 28 Aug 2019
OverviewTechnical DetailsVisualisationsResultsFuture Work • Objectives of the Australian Cancer Atlas (ACA): • Create the first digital, interactive picture of cancer burden at the small-area level across Australia • Informative and easy to use • Accessible (free, mobile/desktop versions) • Include cancer incidence and survival • Include 20 of the most common cancer types • Spatial modelling that incorporates smoothing • Provide policy-makers and health agencies with a better understanding of geographic disparities • Motivate new research to gain a better understanding of why geographical variation exists Earl Duncan GeoMed `191
OverviewTechnical DetailsVisualisationsResultsFuture Work Background: • 2016: • Ethics approval and approval from data custodians from 8 cancer registries (1 from each state/territory) • De-identified data on cancer incidence and survival outcomes • Mid-2017: • Investigate spatial models, pros and cons • Run final model(s) on real data • Data visualisation • Sept 2018: • Atlas was officially launched Earl Duncan GeoMed `192
OverviewTechnical DetailsVisualisationsResultsFuture Work Background: • Collaborative effort between teams from QUT, Cancer Council QLD, and FrontierSI • statisticians • cancer researchers • visualisation experts • project managers • IT specialists • Additional input from focus groups (government, media, and community) Earl Duncan GeoMed `193
OverviewTechnical DetailsVisualisationsResultsFuture Work Reception: • > 500 separate media items, including front page newspaper coverage, television news coverage, and other radio, online and newspaper reports. • > 40,800 distinct users from > 100 countries • Sparked interest from abroad (NZ, Canada) Earl Duncan GeoMed `194
OverviewTechnical DetailsVisualisationsResultsFuture Work Impact so far: • Preliminary estimates helped cancer registries correct their database (some cases had been geocoded incorrectly). • New insights into cancer patterns. • 6 publications, +2 in progress • 14 presentations (1 international) • 2 research collaborations, +5 in progress, + interest from others Earl Duncan GeoMed `195
OverviewTechnical DetailsVisualisationsResultsFuture Work Extensive model testing and evaluation: • Simulated data • Aim: choose the most appropriate spatial model (for incidence) based on: • Model goodness-of-fit • Plausibility of estimates • Computational time and feasibility • Results available in online report: Cramb, S. M., E. W. Duncan, P. D. Baade, and K. L. Mengersen. 2018. Investigation of Bayesian spatial models. Brisbane: Cancer Council Queensland and Queensland University of Technology (QUT). URL:https://eprints.qut.edu.au/115590. Earl Duncan GeoMed `196
OverviewTechnical DetailsVisualisationsResultsFuture Work p14 of report: 304 Earl Duncan GeoMed `197
OverviewTechnical DetailsVisualisationsResultsFuture Work • Results obtained for 15 model/variants (p21 of report) Other issues Plausible? Fast? Fit? BYM Leroux Geostatistical P-spline (tensor) P-spline (radial) CAR Dissimilarity (binary, SEIFA) CAR Dissimilarity (nb, SEIFA) CAR Dissimilarity (binary, res) CAR Dissimilarity (nb, res) Localised autocorrelation G3 Localised autocorrelation G5 Locally adaptive Locally adaptive (rho fixed) WSSP Leroux scale mixture • Also considered but not investigated: Proper CAR model and localised spline models. Earl Duncan GeoMed `198
OverviewTechnical DetailsVisualisationsResultsFuture Work • “The goals of the Australian Cancer Atlas require a delicate balance between conservative, appropriately smoothed estimates, but ones with sufficient spatial variation between those estimates to enable the impact of suitable ecological covariates to be assessed.” • Chosen model: Leroux et al. (2000) model. • Straightforward to implement (CARBayes, WinBUGS) • Easy to interpret • Computationally fast • Comparable model fit to alternatives • Estimates seem plausible Leroux, B. G., X. Lei, and N. Breslow. 2000. “Estimation of disease rates in small areas: a new mixed model for spatial dependence”. In Statistical models in epidemiology, the environment and clinical trials, edited by M. E. Halloran and D. Berry, pp. 179-191. The IMA Volumes in Mathematics and its Applications, vol 116. New York: Springer. DOI: 10.1007/978-1-4612-1284-3_4. Earl Duncan GeoMed `199
OverviewTechnical DetailsVisualisationsResultsFuture Work Earl Duncan GeoMed `1910
OverviewTechnical DetailsVisualisationsResultsFuture Work Earl Duncan GeoMed `1911
OverviewTechnical DetailsVisualisationsResultsFuture Work Incidence model: is the number of cases in area is the expected number of cases (offset parameter) is the log-relative risk (aka log-standardised incidence ratio, log-SIR) is the element of the symmetric spatial weights matrix Earl Duncan GeoMed `1912
OverviewTechnical DetailsVisualisationsResultsFuture Work Modelling cancer survival is more difficult. Several options to consider: • All-cause survival or net survival? • Cause-specific (based on death certificates) • Relative survival (ratio of observed survival to expected survival) • Spatial smoothing? • Software? Relative survival requires: • Estimation of expected survival: • Accurate population counts • Accurate population-mortality data • Assumption of independence (age-standardisation) Earl Duncan GeoMed `1913
OverviewTechnical DetailsVisualisationsResultsFuture Work Relative survival model: • Combine the Leroux model with that proposed by Fairley et al. (2008): Fairley, L., D. Forman, R. West, and S. Manda. 2008. Spatial variation in prostate cancer survival in the Northern and Yorkshire region of England using Bayesian relative survival smoothing. British Journal of Cancer 99 (11): 1786–93. DOI: 10.1038/sj.bjc.6604757. Earl Duncan GeoMed `1914
OverviewTechnical DetailsVisualisationsResultsFuture Work Relative survival model: is the number of deaths; is the expected number of deaths due to causes other than the cancer of interest; is the excess number of deaths; is person-time at risk (an offset parameter) is the excess hazard rate (EHR) Earl Duncan GeoMed `1915
OverviewTechnical DetailsVisualisationsResultsFuture Work The spatial weights matrix, : • quantifies the spatial dependency between each pair of areas. • if areas and immediate neighbours Earl Duncan GeoMed `1916
OverviewTechnical DetailsVisualisationsResultsFuture Work Spatial smoothing: • ‘Smoothing’ (flattening) the risk surface (for incidence, for relative survival). • Two aspects: magnitude (extreme values) and local variation Earl Duncan GeoMed `1917
OverviewTechnical DetailsVisualisationsResultsFuture Work Reasons for smoothing: • Make estimates more realistic (especially when denominator and/or numerator is small). • Make estimates more reliable (reduces uncertainty) by “borrowing information” from neighbours. • Increase privacy (reduces the risk of identifying individual people). • Especially important for rare cancers. Earl Duncan GeoMed `1918
OverviewTechnical DetailsVisualisationsResultsFuture Work Factors that can influence the degree of smoothing: • Type of model • The spatial weights matrix, • Hyperprior on the variance parameter in the spatial random effect term ( on slides 12 and 15) • This seems to be the most influential • A sensitivity analysis is important. Earl Duncan GeoMed `1919
OverviewTechnical DetailsVisualisationsResultsFuture Work Sensitivity analysis for the impact of : • >40 priors tested across multiple cancers under different conditions (e.g. initial values, sample size). • Gamma, inverse-gamma, half-Normal • Final hyperprior chosen based conservative estimates – more confidence that differences are genuine • Prior is “mildly informative”. • Cannot be too vague otherwise smoothing will be insufficient. Earl Duncan GeoMed `1920
OverviewTechnical DetailsVisualisationsResultsFuture Work Spatial models provide a posterior estimate for the SIR and EHR: Point estimate Empirical density & credible intervals The posterior probability that the estimate in the area > 1 Earl Duncan GeoMed `1921
OverviewTechnical DetailsVisualisationsResultsFuture Work Tools to help make inference: • Intuitive colour schemes • Reflect comparison to national average • Red = higher than average, blue = lower than average • Consistent for SIR and survival (flipside of EHR) • Comparison between areas / between cancers for a given area • National perspective of estimates Earl Duncan GeoMed `1922
OverviewTechnical DetailsVisualisationsResultsFuture Work Tools to help understand uncertainty: • “Wave plot” • Indicates the uncertainty of the SIR/EHR estimates • Analogous to a density plot, but for ratio scale parameters Earl Duncan GeoMed `1923
OverviewTechnical DetailsVisualisationsResultsFuture Work Tools to help understand uncertainty: • V-plot • Indicates whether those estimates represented a significant difference to the Australian average • x-axis: point estimate • y-axis: scaled probability (see slide 21) Earl Duncan GeoMed `1924
OverviewTechnical DetailsVisualisationsResultsFuture Work Tools to help understand uncertainty: • Transparency layer • Makes areas whose estimates have a large amount of uncertainty appear less noticeable/more similar to the national average • Can be toggled on/off by user Earl Duncan GeoMed `1925
OverviewTechnical DetailsVisualisationsResultsFuture Work • Estimates for liver cancer SIR somewhat correlate to proportion of Indigenous Australians • More likely to have some of the main risk factors • Biggest known cause of liver cancer in Australia is hepatitis B or C • Most people with hep B are indigenous or were born in sub-Saharan African or Asia-Pacific where the virus is relatively common • Survival tends to be much higher in capital cities. Earl Duncan GeoMed `1926
OverviewTechnical DetailsVisualisationsResultsFuture Work • Melanoma shows strong spatial patterns for incidence • Possible causes: • higher risk on east coast due to outdoor lifestyle/higher sun exposure; and • increased skin cancer awareness (over-diagnoses of thin melanomas?) • lower risk in north/interior due to higher proportion of indigenous Australians • …but relatively minor variations for survival Earl Duncan GeoMed `1927
OverviewTechnical DetailsVisualisationsResultsFuture Work Plans for the future: • New methodology (2 in progress): • Spatio-temporal modelling • Incorporating area-level misclassification • Investigating different measures of survival • New applications/insights: • Ecological modelling (including factors such as socio-demographics, clinical characteristics, risk factors, etc.) • Meta-analysis/clustering analysis (in progress) • New visualisations: • Using cartograms/ “hexmaps” (see sugarbag R package) • Developing similar atlases in other countries Earl Duncan GeoMed `1928
OverviewTechnical DetailsVisualisationsResultsFuture Work More information: Earl Duncan GeoMed `1929
Overview Technical Details Visualisations Results Future Work Key references: Cramb, S. M., E. W. Duncan, P. D. Baade, and K. L. Mengersen. 2018. Investigation of Bayesian spatial models. Brisbane: Cancer Council Queensland and Queensland University of Technology (QUT). URL:https://eprints.qut.edu.au/115590. Fairley, L., D. Forman, R. West, and S. Manda. 2008. Spatial variation in prostate cancer survival in the Northern and Yorkshire region of England using Bayesian relative survival smoothing. British Journal of Cancer 99 (11): 1786–93. DOI: 10.1038/sj.bjc.6604757. Leroux, B. G., X. Lei, and N. Breslow. 2000. “Estimation of disease rates in small areas: a new mixed model for spatial dependence”. In Statistical models in epidemiology, the environment and clinical trials, edited by M. E. Halloran and D. Berry, pp. 179-191. The IMA Volumes in Mathematics and its Applications, vol 116. New York: Springer. DOI: 10.1007/978-1-4612-1284-3_4. Acknowledgements: Contact: • earl.duncan@qut.edu.au • https://bragqut.wordpress.com/people/earl-duncan/ Earl Duncan GeoMed `1930