Download

1 / 24
240 likes | 385 Vues
Boundary layer observations in West Africa using a ground-based 14-channel microwave radiometer. Bernhard Pospichal and Susanne Crewell University of Cologne pospichal@meteo.uni-koeln.de. Bernhard Pospichal, MicroRad 2008. AMMA-African Monsoon Multidisciplinary Analyses.

E N D
Boundary layer observations in West Africa using a ground-based 14-channel microwave radiometer Bernhard Pospichal and Susanne CrewellUniversity of Colognepospichal@meteo.uni-koeln.de
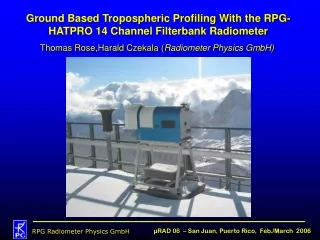
Bernhard Pospichal, MicroRad 2008 AMMA-African Monsoon Multidisciplinary Analyses • AMMA: International project for research on West African monsoon • Large number of remote sensing instruments were operated for the first time in West Africa • A HATPRO microwave radiometer was deployed by the Universities of Bonn and Cologne for one year (2006) in Nangatchori (Ouémé, Benin). Aims of AMMA:
Bernhard Pospichal, MicroRad 2008 HATPRO microwave profiler • Measurement of atmospheric emission in two frequency bands: • A: 22.235 –31.4 GHz, 7 frrequencies on the upper wing of the water vapour absorption line and in the atmospheric window (IWV,LWP) • B: 51.26 – 58.0 GHz, 7 frequencies at the oxygen absorption complex (-> temperature profiles)
Boundary layer scans • Under assumption of horizontal homogeneity, measurements under different elevation angles (90 to 5 degrees) provide additional information on temperature profiles in the atmospheric boundary layer Bernhard Pospichal, MicroRad 2008 HATPRO: two different operation modes • Vertical measurements • high temporal resolution (1 sec) • Simultaneous observation of all 14 channels • Products: • Retrieval of LWP (liquid water path) and IWV (integrated water vapor) • Temperature profiles up to 10 km altitude • Humidity profiles up to 5 km • Retrievals: • Statistical retrieval algorithms are developed on the basis of a large set of atmospheric profiles observed by radiosondes in Northern Australia
Rain mm/day 80 40 0 JAN FEB MAR APR MAY JUN JUL AUG SEP OCT NOV DEC Rain rate mm/d JAN FEB MAR APR MAY JUN JUL AUG SEP OCT NOV DEC 100 0 cloudy (< 7500 m) clear sky no measurements Daily percentage of clouds Bernhard Pospichal, MicroRad 2008 Overview of 2006 Djougou observations IWV kgm-2
IWV statistics JANUARY APRIL JULY DECEMBER • The high number of observations allowed to make monthly statistics of IWV • Main characteristics: • January: several moist air outbreaks (IWV up to 47 kg/m2 in dry season) • April: transition to wet season (IWV from 10 to 52 kg/m2) • July: wet season, low variability (standard deviation only 3 kg/m2) • December: dry season, no moist air masses
LWP statistics JANUARY APRIL AUGUST DECEMBER • Statistics for LWP for different months of 2006 (note: y-axis in logarithmic scale) • Main characteristics: • January: moist air outbreaks caused some cloudiness • April: transition to wet season (still quite few clouds) • August: peak of wet season, large number of cloudy periods, some values exceeding 2000 g/m2 • December: no clouds present!
Temperature, diurnal cycle Bernhard Pospichal, MicroRad 2008 Diurnal cycle of potential temperature in 50 m above ground Diurnal cycle of potential temperature in 700 m above ground
Temperature, diurnal cycle Bernhard Pospichal, MicroRad 2008 Gradient of potential temperature is positive during negative during night and slightly posivite during daytime Differences between wet and dry season: Nighttime inversions much stronger during dry season (maximum in december), Daytime superadiabatic layer close to the ground in dry season, neutral layering in wet season Monthly potential temperature difference: 700-0 m above ground
Example 28 June 2006 Bernhard Pospichal, MicroRad 2008 • Day in wet season • no rain • shallow convection during daytime
Example 28 June 2006 Bernhard Pospichal, MicroRad 2008 HATPRO IWV and LWP
Example 28 June 2006 Bernhard Pospichal, MicroRad 2008 HATPRO relative humidity
Example 6 October 2006 Bernhard Pospichal, MicroRad 2008 • Day towards the end of wet season • One short rainfall event (13 UTC) • Early morning fog, rising PBL, some higher clouds
Temperature, diurnal cycle Bernhard Pospichal, MicroRad 2008
Close view on April 2006 Bernhard Pospichal, MicroRad 2008 IWV kgm-2 diurnal event on April 10/11 1 Apr 10 Apr 20 Apr 30 Apr • Transition from dry to wet season in Djougou (9.7°N) occurs during April IWV ranges from 10 to 50 kgm-2 • Transition is not gradual – Djougou is periodically under the influence of drier (from the north) and moister air (from the south) relative position to inter-tropical discontinuity (ITD) • Diurnal cycle is evident in high frequency oscillations of IWV time series
Surface observations 10/11 April 2006 Bernhard Pospichal, MicroRad 2008 strong inversion weak winds well mixedwind from S Temperature in Nangatchori:solid line: 1.2 m agldashed: 2.5 m agldash-dotted: 4 m agl Wind direction:o Djougoux Nangatchori Wind speed at Djougou All data are 15-min averages
Ceilometer obs 10/11 April 2006 Bernhard Pospichal, MicroRad 2008
RH T 12 18 0 6 12 12 18 0 6 12 Time (UTC) Θ Θe 12 18 0 6 12 12 18 0 6 12
Bernhard Pospichal, MicroRad 2008 Summary: HATPRO microwave radiometer was deployed in West Africa during 2006 Despite the rather bad infrastructure, data availability is > 80% with a temporal resolution of 2 seconds (vertical mode) and 15 minutes (elevation scanning mode) Monthly averaged hourly boundary layer profiles of temperature and humidity show the evolution of theatmosphere throughout the year or in the course of the day Low level jet during March/April has been observedwith high temporal and vertical resolution Outlook: 3D-Scanning of the atmosphere with HATPRO provides a look on water vapour and temperature distribution in the surroundings of the station. This feature has not been available in Africa yet.
(negative axes represent positive values!) Bernhard Pospichal, MicroRad 2008 Recent developments: Azimuth scanning capabilities Total Sky Imager IR IR, LWP and IWV in polar plots. Note: Only the anomaly of the values is shown here! Data from COPS campaign in Black Forest 2007, Courtesy to Stefan Kneifel LWP IWV
Bernhard Pospichal, MicroRad 2008 Case study 14 July 2007 Until 12 UTC asymmetric humidity field after 12 UTC strong decrease in humi- dity by about 10 kgm-2 13:00-14:30 convection in NW direction after 15 UTC: humidity increase For clear sky cases: Strong correlation between IR- und IWV structures
AMMA - African Monsoon Multidisciplinary Analysis Bernhard Pospichal, MicroRad 2008 Thank you for your attention!