Reflection Processing and Analysis
This project utilized five geophysical methods to identify shallow subsurface geometry along the V-Line and Truckee Canal in Fallon, Nevada. We highlighted the reflection analysis, presenting methods, parameters, and results drawn from two reflection lines: one near the TCID power plant and another near the levee. The study compared reflection results with other geophysical methods, notably ReMi, revealing important subsurface features, including depth measurements of levees and velocity profiles. Results show compact soil layers influencing velocity pockets.

Reflection Processing and Analysis
E N D
Presentation Transcript
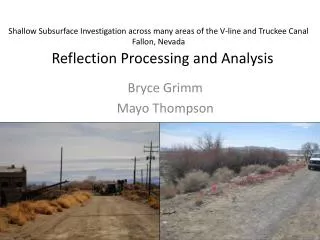
Shallow Subsurface Investigation across many areas of the V-line and Truckee Canal Fallon, Nevada Reflection Processing and Analysis Bryce Grimm Mayo Thompson
Overview Introduction Reflection Parameters Analysis of Reflection Lines (FALL0101 & FALL201-336) Comparison with other methods Conclusions
Introduction • This project involved the use of five (5) geophysical methods across the V Canal and the Truckee Canal in order to identify the shallow subsurface geometry of these areas. • We conducted the reflection portion of this project and the following is the analysis, results and comparison
Reflection Parameters • Refraction was first conducted which helped us to decide our parameters for collection. • 2 lines were conducted: one at the TCID power plant along the same line as ReMi line # 1; the other Southwest of TCID at a part of the levee at a lower height (ReMi line # 3) • We used a .2 ms sample rate, 1000 samples per shot, and 10 shots per shot point.
Reflection Parameters FALL 0101 – TCID power plant • Bison Galileo 21 Seismograph • The line was setup as such: • 24 channels • Group spacing of 0.7 meters • Shot spacing of 1.4 meters • 30 Shots (1 for each geophone group and 3 shot 1.4 meters out from the both ends. • Placed linearly along array
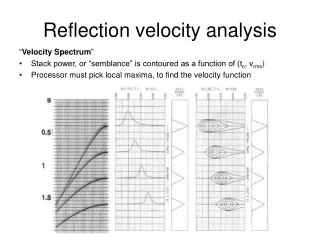
FALL0101 • The program used to analyze this data was jrg500 • First picks were made on the initial reflections to access initial velocities, frequency, and resolutions.
FALL0101 – CVSTACK • After applying geometry, a band-pass filter of 50-75, 250-300 Hz, trace equalization gain and also an automatic gain control, constant velocity stacking was assessed to identify the ideal parameters. • The final parameters came to be: 100 m/s with 24 intervals of 20 m/s.
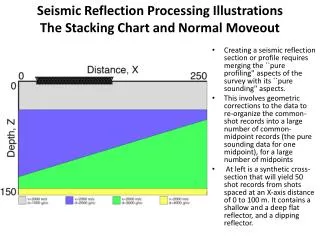
CMPSTACK AND MAKEVELS • Velocities vary from 200-500 m/s in the shallow layers and 900 m/s at the deepest layer. • Depth to the bottom of the levee is 3.3 ± .75 m Bottom of levee 3.3 m High velocity pocket
CMPSTACK AND MAKEVELS • The high velocity pocket seen in the results correlated with a note made on the observers report very well. • The beginning of the pocket is at about 9 meters and we noted that past 7 meters the soil was more compact causing the plate to bounce. The dirt became softer later on in the survey. • Therefore a small higher velocity layer is feasible. Bottom of levee 3.3 m High velocity pocket
Reflection Parameters FALL 201-336 – • Bison Galileo 21 Seismograph • The line was setup as such: • 48 channels • Group spacing of 0.35 meters • Shot spacing of 0.7 meters • 36 Shots (1 for every other geophone group and 6 shots 0.7 meters out from the both ends. • Each group placed was placed with 3 geophones linear to array and 3 perpendicular to the array as shown.
FALL201-336 • The program used to analyze this data was also jrg500 • First picks were made on the initial reflections to access initial velocities, frequency, and resolutions.
FALL201-336 – CVSTACK • After applying geometry, a band-pass filter of 50-75, 250-300 Hz, trace equalization gain and also an automatic gain control, constant velocity stacking was assessed to identify the ideal parameters. • The final parameters came to be: 100 m/s with 24 intervals of 20 m/s. This was the same as the first line. • We decided to use the same parameters because (1) the energy was still constrained and (2) keeping the same parameters ensured similar results.
CMPSTACK AND MAKEVELS • More linear results and not much is seen. • Velocities vary from 100-400 m/s in the shallow layers. • The bottom of the levee is about 2.15 ± .47 m • Middle area has higher fold due to merging of lines
CMPSTACK AND MAKEVELS • Although the results for this line were less interesting, they do essentially show the linear and clear break between the canal and the natural surface.
Comparison with other methods - ReMi • Line 1 was the same amount of geophones conducted with the same starting point as FALL0101. ReMi had a geophone spacing of two times the length of the reflection geophone groups (1.4 meters compared to 0.7 meters) • The canal bank depth determination for this method was 2.5 ± .5 meters while reflection yielded a depth of 3.3 ± .75 meters, a difference of 14%. ReMi inherently has a 20% error (Heath et. al., 2006) and the vertical resolution was about 20%. Therefore the depth to the bottom of the levee is constrained by 2.55 – 3.00 meters. • Next, in terms of velocities, the reflection velocities of the levee were between 200-500 m/s and shear velocities varied from 150-185 m/s. • Because shear waves are 60% of reflection waves, ideal shear wave velocities are between 140 – 300 m/s which fit perfectly with the results shown.
Comparison with other methods - ReMi • Line 3 was 24 geophones conducted with the same starting point as FALL201-336 • which was 48 geophone groups. ReMi had a geophone spacing of four times the length of our survey (1.4 meters compared to 0.35 meters) • The canal bank depth determination for this method was 2.3 ± .46 meters while reflection yielded a depth of 2.15 ± .47 meters. Remi inherently has a 20% error (Heath et. Al, 2006) and the vertical resolution was about 20%. Therefore the depth to the bottom of the levee is constrained by 1.84 – 2.61 meters. • Next, in terms of velocities, the reflection velocities of the levee were between 100-400 m/s and shear velocities varied from 150 - 190 m/s. • Because shear waves are 60% of reflection waves, ideal shear wave velocities are between 80 – 240 m/s which fit perfectly with the results shown.
Comparison with other methods - Refraction • Refraction line 1 coincides with FALL0101. It has a canal depth of 2.3 m but an interpretation can range from 1.0-3.0 m and velocities ranging from 200-500 m/s. • This is a bit lower in depth than the reflection results but depth ranges fit into the depth calculated as 2.55-3.00 although the velocities match.
Comparison with other methods - Refraction • Refraction line 3 coincides with FALL201-336 and has a canal depth of 2.5 m. The interpretation ranges from 1.0-3.0 m and velocities ranging from 200-700 m/s. • This matches with the reflection data, falling into the range of reflection depths of 1.84 – 2.61 m but is higher in velocity than the 100-400 m/s resulted.
Comparison with other methods – Electrical Resistivity • The only electrical survey conducted was on the line FALL201-336. • The calculated depth to native soil varied from 2.5 – 3.1 meters
Comparison with other methods – Electrical Resistivity • The only electrical survey conducted was on the line FALL201-336. • The calculated depth to native soil varied from 2.5 – 3.1 meters
Conclusions – FALL0101 • Given the reflection results and two comparative methods (ReMi and Refraction), the depth to bottom of levee is between 2.5 – 3.0 meters with velocities of 200-500 m/s. • Conducting resistivity in this area might have narrowed the depth of the canal
Conclusions – FALL201-336 • Given the reflection results and three comparative methods (ReMi, Refraction and Electrical), the depth to bottom of levee is between 2.5 – 2.6 meters with velocities of 200-400 m/s when using the constraints of each process.
THE END • QUESTIONS??? References: Heath, K., J. N. Louie, G. Biasi, A. Pancha, and S. K. Pullammanappallil, 2006, Blind tests of refraction microtremor analysis against synthetics and borehole data: CD-ROM Proceedings of the 100th Anniversary Earthquake Conference.