Download
1 / 20
200 likes | 330 Vues
The ODOT Wildlife Hotspot Study evaluates wildlife-vehicle collision data in Oregon, aiming to identify high-frequency collision zones. Utilizing a statewide analytical approach, the study compiled existing carcass pick-up records and analyzed crash data from ODOT District 10, resulting in the identification of 2,184 significant records. Advanced methods like Nearest Neighbor Analysis and Kernal Density were employed to understand collision patterns better. Recommendations include enhancing data linking methods, prioritizing wildlife linkage areas, and encouraging coordination with wildlife agencies to mitigate future collisions.

E N D
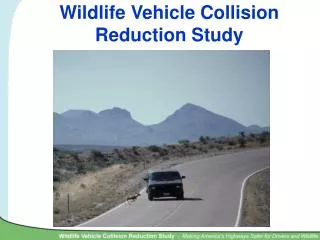
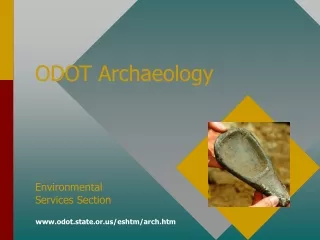
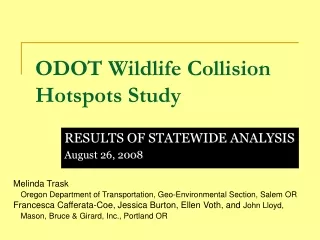
ODOT Wildlife Hotspot Study Prepared by: Melinda Trask Oregon Department of Transportation, Geo-Environmental Section, Salem OR John Lloyd, Francesca Cafferata Coe, Jessica Burton, and Ellen Voth Mason, Bruce & Girard, Inc., Portland OR Pilot Study: ODOT District 10
Wildlife Collision Data in Oregon • Types of Data: • Crash Records • Dispatch Carcass Records • Road Kill Observations • Expert Opinion
ODOT's Wildlife Collision Prevention Plan • ODOT’s Mission and Addressing wildlife passage • Lack of information • Priorities • Non-regulated but supported by FHWA, ODFW, USFWS, CETAS, nationwide attention
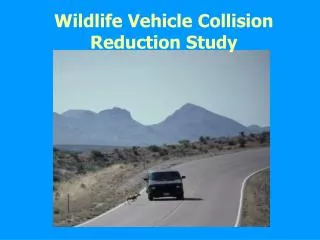
US Hwy ODOT Wildlife Collision Hot Spot Study • Statewide, analytical approach • Purpose: identify high frequency animal-vehicle collision zones • Uses existing carcass pick-up records • Pilot study to determine the feasibility of extending this analysis statewide Density: 1-2 animals 2-5 animals 6-10 animals
Data Preparation • Original # Records in D10 = 6,546 (100%) • Step 1: Data Processing • Tabular Information Problems (28% reduction) • Narrowing Acceptable parameters (additional 21% reduction) • Step 2: Linkage to GIS (additional 17% reduction) • GIS Mapping • Route ≠ ODOT Highway Number • Final Data set totals 2,184 records (33% of total)
Results: Nearest Neighbor Analysis • Wildlife-vehicle collisions occur significantly closer together than would be expected by chance • Nearest Neighbor Index = 0.69 • Nearest Neighbor Index < 1 • Nearest Neighbor distance not included in confidence interval • Does not identify where the clusters occur
Lessons Learned Data Processing • Long term: ODOT improving methods for tying field data to ODOT highway referencing system Data Analysis • The four methods of analysis offer complimentary information. • The Kernal Density Analysis provides the most informative results for ODOT management decisions.
Recommendations • This study did not address explanatory factors contributing to wildlife vehicle collision hotspots • ODOT Management Decisions • Coordination with Maintenance
Future Work • Apply what has been learned to other parts of the state highway network • Prioritize with ODOT staff • Identify explanatory factors contributing to wildlife vehicle collision hotspots (not currently funded) • Wildlife Linkage Areas • Workshops led by ODFW • GIS maps • Combine w/hot spots • Evaluate barriers