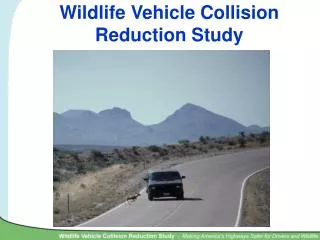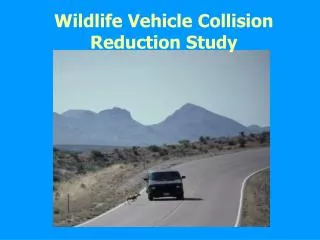
Wildlife Vehicle Collision Reduction Study
270 likes | 411 Vues
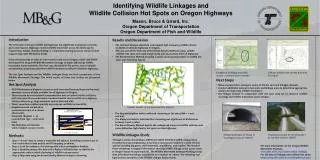
Wildlife Vehicle Collision Reduction Study. Why this Study. Goals of the Study. What We found Out. Annual WVCs Estimated by Insurance Industry. (Data Source: State Farm Insurance). Total WVCs and Total Crashes By Year. Annual WVCs Estimated by Insurance Industry. (Data Source: GES).

Wildlife Vehicle Collision Reduction Study
E N D
Presentation Transcript
Annual WVCs Estimated by Insurance Industry (Data Source: State Farm Insurance)
Total WVCs and Total Crashes By Year Annual WVCs Estimated by Insurance Industry (Data Source: GES)
Monthly Distribution of WVCs 0.25 FARS HSIS GES 0.2 0.15 Proportion of Collisions 0.1 0.05 0 JAN FEB MAR APR MAY JUN JUL AUG SEP OCT NOV DEC (Data Source: FARS, HSIS, GES)
0.12 Time-of-Day Distribution FARS GES HSIS 0.1 0.08 Proportion of Collisions 0.06 0.04 0.02 0 0 1 2 3 4 5 6 7 8 9 10 11 12 13 14 15 16 17 18 19 20 21 22 23 Hour of Day (Data Source: FARS, GES, HSIS)
WVCs by Number of Lanes 100% WVC ALL 80% 60% Percent of Accidents 40% 20% 0% 1 2 3 4 5 6 7 Number of Lanes (Data Source: GES).
WVC ALL Crashes by Average Daily Traffic 0.7 0.6 0.5 0.4 Proportion of Collisions 0.3 0.2 0.1 0 1 to 5001- 10,001- 15,001- 20,001- 25,001- 30,001- >35,000 5000 10,000 15,000 20,000 25,000 30,000 35,000 (Data Source: HSIS) ADT
Age Distribution for All Crashes and WVCs 0.05 0.04 All WVC 0.03 Proportion of Collisions 0.02 0.01 0 1 11 21 31 41 51 61 71 81 91 Driver Age (Data Source: HSIS).
Severity of Injury Distribution for WVCs vs. All Crashes All Collisions WVCs Only 0.5% 0.5% 1.7% 4.3% 0.04% 2.3% 9.4% None None Possible Possible 17.6% Minor Minor Severe Severe Fatal Fatal 68.3% 95.4% (Data Source: GES).
DESCRIPTION DEER ELK MOOSE Vehicle repair costs per collision $1,840 $3,000 $4,000 Human injuries per collision $2,500 $5,000 $10,000 Human fatalities per collision $1,500 $6,000 $12,000 Towing, accident attendance and investigation $125 $375 $500 Monetary value animal per collision $2,000 $3,000 $2,000 Carcass removal and disposal per collision $50 $100 $100 TOTAL $8,015 $17,475 $28,600 Estimated Costs of WVC (Deer, Elk, and Moose)
Wildlife Crossing with Fencing 87% average reduction in WVCs
Wildlife Fencing Reported reductions in WVCs - 80-99% Wildlife fencing along US Hwy. 93 on Flathead Indian Reservation, MT
VERMONT ARIZONA
Reduce Speed by Traffic Calming, Reducing Design Speed 20 15 10 Roadkill per Mile 5 0 15 25 35 40 45 55 Posted Speed Roadkill by Posted Speed Limit in Yellowstone National Park Data Source: Gunther et al. 1998). Speed Bumps Used to Reduce WVCs in Australia
Measures For Which Research or Construction Resources Should Not Be Used • Standard wildlife warning signs • Deer reflectors and mirrors • Audio signals in the right-of-way or deer whistles on vehicles • Olfactory repellants • Deer flagging models • Hazing • Intercept feeding • Wildlife relocation in order to reduce population size • Anti-fertility treatment in order to reduce population size • Seasonal road closures • Reflective collars placed on wildlife
Future Actions • Incorporation of WVC reduction into the early stages of planning and design • Develop and implement guidelines and standards for collecting and reporting WVCs • Develop and implement guidelines for the evaluation of mitigation measures • Evaluate effectiveness of mitigation measures PDA-GPS prototype road kill data collector
Make existing mitigation measures more effective Develop & apply population viability models to optimize location, type and dimensions of mitigation measures Establish national funding source for WVC reduction Technology transfer Future Actions Test site for 8 different roadside animal detection systems - Lewistown, MT
Performing Organization Western Transportation Institute Montana State University P.O. Box 174250 Bozeman, MT 59717 Under Contract to: The Louis Berger Group, Inc. 30A Vreeland Road Florham Park, NJ 07932 Sponsoring Agency: Federal Highway Administration Office of Acquisition Management 400 7th St. SW HAAM-30, Room 4410 Washington DC 20590-0001