Comprehensive Metabolite Profiling Using UHPLC-MS and GC-MS Techniques for Polar and Lipophilic Compounds
This study presents a detailed methodology for the identification and profiling of metabolites using advanced techniques such as GC-MS, UHPLC-MS, and NMR. The polar and lipophilic profiles of dry tissue samples were analyzed through targeted GC-MS deconvolution and metabolite identification. Techniques like AMDIS and spectral matching with custom libraries were employed for enhanced accuracy. Additionally, solid-phase extraction combined with UHPLC and NMR analysis were performed to elucidate complex metabolome profiles, ensuring robust identification of flavonoids and saponins, among other compounds.

Comprehensive Metabolite Profiling Using UHPLC-MS and GC-MS Techniques for Polar and Lipophilic Compounds
E N D
Presentation Transcript
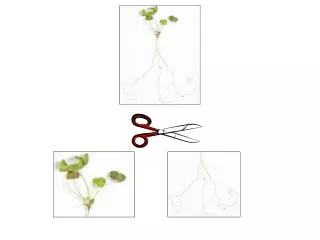
10 mg Dry Tissue MeOH +H2O & CHCl3 H2O/MeOH/CHCl3 H2O/MeOH CHCl3 Polar Lipophilic GCMS derivatization
POLAR Profile LIPOPHILIC Profile GCMS deconvolution and metabolite identification are performed using AMDIS and spectral matching with commercial & custom EI GC-MS Libraries UHPLC-MS deconvolution using Bruker Dissect, Waters MarkerLynx, and Agilent Mass Hunter. Metabolite identification via spectral matching with Custom (-)ESI UHPLC-MS & MS/MS Libraries of Authentic Compounds.
UHPLC-UV-MS-SPE-NMR Bruker/Spark Holland Prospeckt 2 Solid Phase Extraction Mass Spectrometer Make-up Pump 1.5 ml/min H20 UHPLC Analytical Column 0.560 ml/min UV waste 600 MHz NMR With Cryoprobe
UHPLC-UV-MS-SPE-NMR Bruker/Spark Holland Prospeckt 2 Solid Phase Extraction Make-up Pump 1.5 ml/min H20 UHPLC Mass Spectrometer Analytical Column 0.560 ml/min UV waste 600 MHz NMR With Cryoprobe
UHPLC-MS-SPE-NMR Bruker Maxis Qtof-MS/MS MS & SPE Splitter Gilson liquid handler For SPE eluant collection Dr. Dennis Fine Waters AcquityIClass UHPLC With photodiode array detector Prospect 2 Solid Phase Extraction Unit w/ 2 x 96 cartridges & deuterated solvent elution
LC/QTOF SPE Profile of Flavone/Saponin Mix Reference Spectrum of authentic umbelliferone ~900 ngUmbelliferone1H NMR
Current M. truncatula Metabolome Coverage Profiled Level#1 IDS* Shoot GCMS Polar 300 136 Shoot GC-MS nonpolar 250 112 GC-MS Shoot waxes 200 48 Volatile SPME-GCMS 150 74 UHPLC-QTofMS 200 75 Hormones GCMS/LC-QqQMS 25 25 = 1125 Total peaks profiled = 470 Total Peaks Profiled *IDs based upon co-characterization with authentic standards and per Sumner et al, 2007. Proposed minimum reporting standards for chemical analysis, Metabolomics, 3(3) 211-221