Analyzing Graphs of Rational Functions: A Step-by-Step Guide
70 likes | 191 Vues
This guide provides a comprehensive approach to analyzing the graph of a rational function. It covers key objectives such as finding the domain, locating intercepts, testing for symmetry, identifying vertical and horizontal asymptotes, and determining where the graph is above or below the x-axis. By following systematic steps, you can graph rational functions accurately, illustrated with an example that details the process from finding intercepts to final graph construction. This is essential for mastering rational functions in algebra and trigonometry.

Analyzing Graphs of Rational Functions: A Step-by-Step Guide
E N D
Presentation Transcript
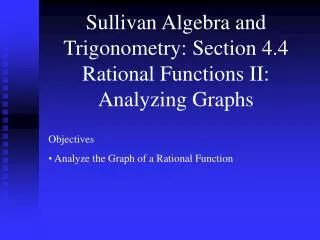
Sullivan Algebra and Trigonometry: Section 4.4Rational Functions II: Analyzing Graphs • Objectives • Analyze the Graph of a Rational Function
To analyze the graph of a rational function: a.) Find the Domain of the rational function. b.) Locate the intercepts, if any, of the graph. c.) Test for Symmetry. If R(-x) = R(x), there is symmetry with respect to the y-axis. d.) Write R in lowest terms and find the real zeros of the denominator, which are the vertical asymptotes. e.) Locate the horizontal or oblique asymptotes. f.) Determine where the graph is above the x-axis and where the graph is below the x-axis. g.) Use all found information to graph the function.
b.) y-intercept when x = 0: a.) x-intercept when x + 1 = 0: (– 1,0) y– intercept: (0, 2/3) c.) Test for Symmetry: No symmetry
d.) Vertical asymptote: x = – 3 Since the function isn’t defined at x = 3, there is a hole at that point. e.) Horizontal asymptote: y = 2 f.) Divide the domain using the zeros and the vertical asymptotes. The intervals to test are:
Test at x = – 4 Test at x = –2 Test at x = 1 R(– 4) = 6 R(–2) =–2 R(1) = 1 Above x-axis Below x-axis Above x-axis Point: (– 4, 6) Point: (-2, -2) Point: (1, 1) g.) Finally, graph the rational function R(x)
x = - 3 (3, 4/3) There is a HOLE at this Point. (-4, 6) (1, 1) y = 2 (-2, -2) (-1, 0) (0, 2/3)