Download
1 / 22
230 likes | 247 Vues
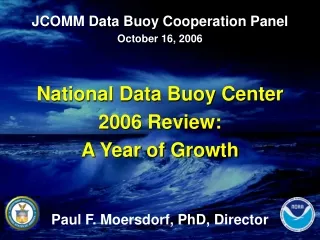
JCOMM Data Buoy Cooperation Panel October 16, 2006 National Data Buoy Center 2006 Review: A Year of Growth Paul F. Moersdorf, PhD, Director. National Data Buoy Center.

E N D
JCOMM Data Buoy Cooperation Panel October 16, 2006 National Data Buoy Center 2006 Review: A Year of Growth Paul F. Moersdorf, PhD, Director
National Data Buoy Center Objective: Build and sustain a global observing system and ensure consistently high quality data responsive to the long-term climate and maritime service requirements. Part 1 of brief Part 2 of brief
Part 1:NOOSS NDBC Ocean Observing System of Systems
Observing Growth at NDBC • NOAA’s major national and international contributions are through its coastal marine and global climate observation initiatives. • NDBC has collected meteorological data in U.S. coastal waters for over 30 years. • NDBC now has a global responsibility that includes: • Tropical Atmosphere Ocean (TAO) array • Pilot Research Array in the Tropical Atlantic • Tsunami detection network • Hurricane buoy network
IOOS Required Parameters* Lower Ocean Ocean Atmosphere Surface Sub-surface Temperature Temperature Temperature Pressure Salinity Salinity Wind Currents Currents Precipitation Wave Height / Period Dissolved Oxygen Humidity Wave Direction Carbon Dioxide Radiation Sea Height/ LevelChlorophyll Fluxes Fluxes Nutrients Visibility Radiation Radiation “Air quality” Ocean color Marine monitoring Sea Ice Bathymetry Toxins / pollutants Toxins / pollutants Acoustic Signals * GREEN parameters can be operationally observed by NDBC.
Wind speed / direction Air temp / humidity / pressure Tracking / communications Navigational beacon Solar panels Magnetometer, compass, computer, batteries, position tracking Wave height, period, direction* Ocean temperature Surface currents Surface salinity Current profiler Mooring Bottom tsunami pressure sensors* Air Water * Not on all buoys
Observing System Platforms C-MAN station DART II 6-meter NOMAD TAO 3-meter discus C-MAN station
Coastal Weather Buoys 92 06-062 (May 2006)
Tropical Atmosphere Ocean 55 06-062 (May 2006)
Deep-ocean Assessment and Reporting of Tsunamis 19 06-007 Group 7A (Aug 2006)
DART (planned) 19 Stations Presently Established 9 Stations to be Established Locations Determined Stations to be Established Locations Conceptual 11 06-007 Group 7A (Aug 2006)
Hurricane Supplemental Buoy 15 06-062 (May 2006)
Coastal Automated Stations 56 06-062 (May 2006)
Part 2:IOOS DAC Integrated Ocean Observing System Data Assembly Center
Data Assembly Center Activities • Occupy a leadership role in developing and setting IOOS standards and protocols through workshops, meetings, etc. • Obtain marine weather and ocean observations from NDBC and other NOAA platforms, regional observing systems, universities and commercial sites. • Ensure the consistent, high quality of these observations in a timeframe consistent with needs of forecasters, mariners, modelers, and archive centers. • Disseminate the data to diverse user communities via multiple U.S. IOOS recommended transmission paths.
PARTNERS 271 06-062 (May 2006)
NDBC IOOS DAC Partners* Present data providers and station numbers: National Water Level Observation Network – 138 stations Scripps Institute of Oceanography – 26 Coastal Ocean Monitoring and Prediction System – 17 Gulf of Maine Ocean Observing System – 10 Long Island Sound Ferry – 10 Great Lakes Environmental Research Laboratory – 8 Chesapeake Bay Observing System – 7 Carolina Coastal Ocean Observation and Prediction System – 6 LSU Wave-Current Surge Information System for Coastal Louisiana – 5 Texas Automated Buoy System – 5 Weather Forecast Office Green Bay – 4 * Not including oil and gas industry ocean current data sites.
NDBC IOOS DAC Partners(continued) Present data providers and station numbers: University of Connecticut – MYSOUND – 4 stations Texas Coastal Ocean Observation Network – 4 Louisiana Universities Marine Consortium – 4 Stevens Institute of Technology – 4 Skidaway Institute of Oceanography – 3 Monterey Bay Aquarium Research Institute – 3 (includes CIMT) Coastal Ocean Research and Monitoring Program – 3 Dauphin Island Sea Lab – 3 Shell Oil – 3 CORIE – 2 Center for Integrated Marine Technology – 1 North Carolina Coastal Ocean Observing System – 1 University of Southern Mississippi – 1 Forest Oil – 1 SF Beams – 1
Joint Project with Oil & Gas Industry New Orleans North Central Gulf of Mexico Real-time ocean current data is transmitted from each of the ~50 platforms to NDBC for standard QA/QC processing and distribution.
NDBC IOOS Data Assembly Center Katrina O & G TAO
Closing Thoughts • This is a good time to be in Ocean Observing! • Long term success depends on technology: • Low / No cost maintenance; smaller, power efficient, economical (but still accurate) sensors; • survivable platforms.
Thank You photo courtesy of MeteoFrance