Data Processing Functions
Data Processing Functions. CSC508 Techniques in Signal/Data Processing. Signal Processing. Signal Conditioning. Filtering. Thresholding. Segmentation. Feature Extraction. Data Correlation. State Estimation. Identification. Data Processing. An Overiew of Signal/Data Processing.

Data Processing Functions
E N D
Presentation Transcript
Data Processing Functions CSC508 Techniques in Signal/Data Processing
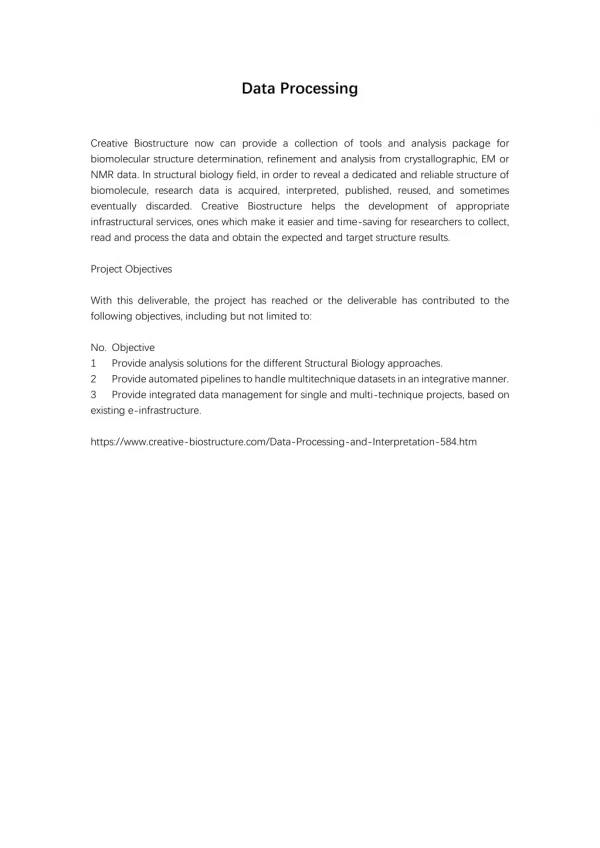
Signal Processing Signal Conditioning Filtering Thresholding Segmentation Feature Extraction Data Correlation State Estimation Identification Data Processing An Overiew of Signal/Data Processing Signal Processing - includes preamplification, calibration, SNR enhancement, thresholding and segmentation. It is everything we do before we attempt to separate the data containing signals from those containing only noise. Data Processing - starts with feature extraction and includes correlation, state estimation and identification. These functions are performed on a reduced description of the entity or entities being measured.
Signal Conditioning Depending on the type of signals being taken, Signal Conditioning can include: Preamplification Impedance Matching Analog-to-Digital (A/D) Conversion Responsivity Correction Calibration Gain Correction
Filtering There are many different types of filtering. The purpose of filtering is to preferentially increase the amplitude of the signal over that of the noise. Remember what is signal and what is noise depends on the application. Spike Circumvention - Median Filter Finite Impulse Response (FIR) Filter Infinite Impulse Response (IIR) Filter Spectral (Frequency Domain) Filter Time-Delay and Integration (TDI) Pulse Matching 2D Filtering - e.g. Laplacian or Sobel
Thresholding Thresholding is the first step in the separation of the data containing signals from the data containing only noise. In thresholding establish one or more criteria for testing the data samples. If a sample meets the criteria it is designated as containing signal information otherwise it is designated as noise.
Segmentation Once we have detected the candidate objects by threshold exceedance we segment the measurement space by extracting regions around the exceedances.
Min Position Amplitude Area Shape Speed Direction Max Feature Extraction Each segment is processed to determine if, in fact a signal is present. When a signal is confirmed a collection (vector) of characteristics or features are computed. There should be one vector for each measured object or entity in the measurement data set. 1 2 : : N Pos, Amp, Area, Shape, Vel, Dir Pos, Amp, Area, Shape, Vel, Dir Pos, Amp, Area, Shape, Vel, Dir Pos, Amp, Area, Shape, Vel, Dir Pos, Amp, Area, Shape, Vel, Dir
t0 t1 t2 tn Data Correlation When we make multiple measurements of more than one object at the same time, we sometimes have to correlate the observations for each object. Data correlation is the development of a time history on individual objects.
meas. vect. t1 t2 t3 t4 tn State Estimation Once a time history of an object or entity has been collected, we can develop a state estimate for the object. Depending on the application the state estimate may be a more precise value for a fixed measurement vector or it may be a function to predict the future state of the object. Time Hisory of an Object or Entity
Identification Other elements of the vectors collected in the time hisory can be used to derive a position of the object or entity in discrimination space. Through theoretical analysis or experimental trials we can develop models of object classes in the discrimination space. The proximity of a particular objects vector to one of these models can be used to classify the type of object we have measured.
Summary The most powerful pattern recognition system known is the human eye/brain. Algorithm development is greatly enhanced by transforming the problem/solution space into a graphical representation. One of the most difficult tasks of signal processing is getting the measurements into a form accessible by a program. The careful application of relatively simple techniques can produce surprisingly robust algorithms. The combination of signal processing and data processing are used to solve complex real-world problems.