Processing the Data
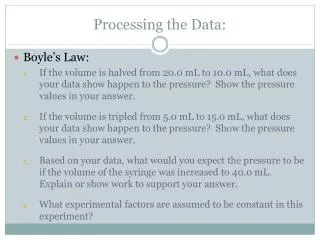
Processing the Data. Transformation of Data. Percentage change (GDP) or growth rate Per capita measures (GNP per capita) Index number Price index(CPI) Stock market index (Bursa Malaysia) Producer price index (PPI) Industrial Production Index(IPI).

Processing the Data
E N D
Presentation Transcript
Transformation of Data • Percentage change (GDP) or growth rate • Per capita measures (GNP per capita) • Index number • Price index(CPI) • Stock market index (Bursa Malaysia) • Producer price index (PPI) • Industrial Production Index(IPI)
Converting nominal to real value (example GDP) • Changing base years (example CPI or RER) • Interpolation techniques (annual data to quarterly and monthly) • Exchange rate conversions (PPP)
i. GDP Growth Rate • The level of real GDP data: From 1970 – 2004 (35 years of data) denoted by Yt, for t = 1 to 35. • People are often more interested in how the economy is growing over time, or in real GDP growth. • A simple way to measure growth is to take the real GDP series and calculate a percentage change for each year. % change =
ii. Gross National Income per Capita • To make comparisons of GNP between countries, currency exchange rates must be taken into account. • Gross National Income (GNI) is a measure used to make international comparisons of output. GNI is GNP converted into dollars using an average of currency exchange rates over several years adjusted for rates of inflation. • GNI divided by population equals gross national income per capita.
iv. Nominal Versus Real GDP • Real GDP uses constant base-year prices to value the economy’s production of goods and services. • Nominal GDP is GDP measured in current dollars, or the current prices we pay for things. Nominal GDP includes all the components of GDP valued at their current prices.
An accurate view of the economy requires adjusting nominal to real GDP by using the GDP deflator. • Nominal GDP is converted to real GDP as follows:
Processing the data • Having collected data, the researcher must quantify it, put it in computer-readable form, and analyze the data statistically. • The stage for data analysis is set by the researcher’s theoretical model of anticipated relationships, as this limits and guides the kinds of analyses that can be carried out.
Facts or data never speak for themselves, they must be analyzed and interpreted [data massaging]. • Data analysis begins with a statement of hypotheses, the construction of a theoretical model, or at the very least, implicitly anticipated relationships among a set of variables.
Processing Data • Coding - Before data are entered into a computer, coding schemes must be developed for every variable or question. Only applied for primary data normally questionnaire
ii. Editing • Is a quality control process applied mostly to surveys to ensure that the information on a questionnaire or interview schedule is ready (complete, error free and readable) to be transferred to the computer for analysis. • Editing is carried out both during and after the process of data collection, and much of it occurs simultaneously with coding. Again it is for primary data analysis.
Entering the Data - The data that are entered into the computer are stored on a disk or other media in a computer file, called a data file. • Cleaning • Involves eliminating errors in coding and in transmitting the data to the computer. • Data processing errors are avoidable by exceedingly careful about entering the data and to use every possible method of checking for mistakes. • Data Analyses
Data Analysis Strategy • known characteristics of the data (level of measurement: nominal, ordinal, interval, ratio) • properties of statistical tests • assumptions underlying tests • data analysis strategy – link to objectives and ultimately the research problem
Evaluation of the data’s validity • Methodology used to collect data – critically examine sample design, response rate questionnaire design and administration, field work procedures, data analysis techniques and reporting • Error – accuracy of data – errors in each stage of the research process • Currency – when the data was collected • Objectivity – purpose for which the data was collected
Nature – the content of the data – how key variables are defined; units of measurement; categories used etc – how consistent are they with researcher’s needs • Dependability of the data – examine the expertise, credibility, reputation and trustworthiness of the source.
Data Analysis • a group of methods and techniques that can turn data into valuable information and insights and help researchers to draw defensible and actionable conclusions. • descriptive statistics –frequency distributions; measures of central tendency; variance; dispersion
inferential statistics – hypothesis testing • univariate • bivariate – association (relationship) or differences • Multivariate • Forecasting
Types of Economic Data • Time Series Data • Cross-sectional Data • Panel Data
Time Series Data • Data is collected at specific points in time • The data are ordered by time • The underlying phenomenon which we are measuring (e.g. GDP or wages or interest rates, etc) is refereed to as a variable • Time series data can be observed at many frequencies
Time Series Data… • Commonly used frequencies are: • annual (i.e. a variable is observed every year) • quarterly (i.e. four times a year) • Monthly, weekly or daily • Hourly (financial data such as changes in the price of stocks) • Notation: Yt an observation on variable Y at time t
Cross-Sectional Data • Data that is characterized by individual units • These units might refer to people, companies, sectors or countries • The ordering of the data typically does not matter • Notation: Yi an observation on variable Y for individual i. • Data set run from individual i = 1 to N • N indicates the number of cross-sectional units
Panel Data • Data sets have both a time series and a cross-sectional component • For example, GDP for 13 ASEAN countries from 1980 – 2004 • N = 13 and T = 25 years • Notation: Yit an observation on variable Y for unit i at time t
Interpolation of Observations • Quarterly interpolation from annual observations • Yt(1) = 0.0546875Yt-1 + 0.234375Yt – 0.0390625Yt+1 • Yt(2) = 0.0078125Yt-1 + 0.265625Yt – 0.0234375Yt+1 • Yt(3) = -0.0234375Yt-1 + 0.265625Yt + 0.0078125Yt+1 • Yt(4) = -0.0390625Yt-1 + 0.234375Yt + 0.0546875Yt+1 Gandolfo, G.(1981) Qualitative Analysis and Econometric Estimation of Continuous Time Dynamic Models. North Holland Publishing Company.
Interpolation of Observations Example: Y 2001 1450 2002 1680 2003 1750 2004 1940 Find quarterly data of Y using the interpolation technique
Data Presentation • Descriptive Statistics • Mean, Standard Deviation, Max, Min, Normality, Skewness, etc of the variables • Correlations • the strength of the relationships among the variables • Figures • Time series plots, scatter diagram, bar chart, etc.
Correlations Notes: PRI = private sector credit; DOC = domestic credit; RGDPC = real GDP per capita; ROL = rule of law; TO = trade openness; FO = financial openness.