Download
1 / 79
790 likes | 950 Vues
The Holy Grail of Trauma. Finding the key to improving survival. Publication Explosion. Trauma and Blood Transfusion – 1990 - 2010. Outline. Improving survivability in trauma. Magnitude of the improvement gap. 1. Transfusion options. 2. The evidence from these options. 3.

E N D
The Holy Grail of Trauma Finding the key to improving survival
Publication Explosion Trauma and Blood Transfusion – 1990 - 2010
Outline Improving survivability in trauma Magnitude of the improvement gap 1 Transfusion options 2 The evidence from these options 3 Evidence for these options 4 Goal-directed therapy 5 Summary http://www.llf.org.uk/resource/llf_blood_transfusion_jpeg.jpg
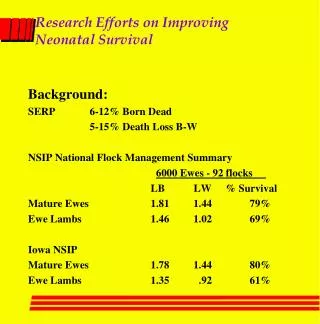
How do we quantify the potential improvement gap? • Chart and autopsy studies • Before and after implementation of trauma systems • Time to death • Country comparisons
Preventable Deaths Esposito TJ, et al. J Trauma. 1995 Nov;39(5):955-62 41 preventable deaths in Montana in 1990
Preventable Deaths Esposito TJ, et al. J Trauma 2003; 54: 663-70 25 preventable deaths in Montana in 1998
Preventable Deaths Davenport RA, et al. B J Surg 2010; 97: 109-117 • Preventable Deaths at Royal London Hospital before & after implementation of a trauma system
Trauma Systems MacKenzie EJ, et al. N Engl J Med 2006; 354: 366-78 • Mortality outcomes in 18 trauma hospitals and 51 non-trauma centers in 14 states (18,198 patients) • Mortality rates – Death in hospital (adjusted): • 7.6% trauma centers • 9.5% non-trauma • Relative risk 0.80 (0.66-0.98) • Subgroup analysis suggested benefit restricted to those under 55 years of age (or no improvement in the ‘elderly’) 1.9%
Survivability in Trauma Twijnstra MJ, et al. Ann Surg 2010; 251: 339-43. • Trauma patients treated in the Netherlands before and after implementation of a trauma system (n=68,041) • Mortality rates – Death in hospital: • 2.6% before • 2.3% after • Relative risk 0.89 (0.80-0.98) • Adjusted OR – 0.84 (0.76-0.94) • Subgroup analysis – trauma system appeared to assist the less severely injured and elderly patients 0.3%
35% died in the 1st 15 min When do patients die in the first 24 hrs?Acousta JA, et al J Am Coll Surg 1998; 186: 528-533
Resuscitation Outcomes Consortium Minei JP, et al. Ann Surg 2010; 252:149-157
10 of 437 (2.3%) deaths deemed preventable Nothing at the scene has changed in 30 years Baker CC, et al. Am J Surg 1980; 140:144-150 53%
Country comparisons Christensen MC et al. J Trauma 2010; 69: 344-352
Bottom line? 0.3-6% of all trauma deaths might be preventable (and a subgroup of these might be salvageable with transfusion strategies)
Incidence of Injury in USA 2009 CDC Statistics • 36.8 million ‘injuries’ in 2009 • 122/1000 population • 182,479 deaths • 60.5/100,000 • If 1% preventable… • And half of the deaths ‘transfusion-related’… • 913 deaths might be preventable with better transfusion support
Prevention – Seat Belts Thoma T. Ann Emerg Med 2009; 54: 837-839
22,523 gun licenses refused or revoked between 1999 and 2008 from individuals deemed a potential risk to themselves or to others Prevention – Gun control People don’t kill people, guns kill people
1 in 100 U.S. Adults Behind Bars, New Study Says NY Times Feb 28, 2008 Prevention – Gun control Guns don’t kill people, people kill people
Outline Improving survivability in trauma ✓ Magnitude of the improvement gap 1 Transfusion options 2 The evidence from these options 3 Evidence for these options 4 Goal-directed therapy (my option) 5 Summary http://www.llf.org.uk/resource/llf_blood_transfusion_jpeg.jpg
Non-transfusion Options that work Transfusion is not the only option Scoop and Run • RCT published in the NEJM in 1994 showed a 8% absolute increase in survival for penetrating traumas 3 1 Insurance Insurance at the time of gunshot injury translates into a 3% absolute decrease in mortality 2 Trauma Systems The implementation of organized trauma systems translates into a 1.9% absolute increase in survivability • Bickell et al. NEJM 1994; 331: 1105-9 • Dozier KC, et al. J Am Coll Surg 2010; 210: 280-5. • MacKenzie et al. N Engl J Med 2006; 354: 366-78
Women Rule Bullard MK et al, Surgery. 2010 Jan;147(1):134-7. “We propose that the administration of exogenous estrogen will improve outcomes after injury and hemorrhage” “Imagine the …possible benefits to early estrogen administration in a testosterone-laden biker, screaming obscenities in your trauma bay.”
Non-transfusion options that don’t work The senior surgeon • A study from Johns Hopkins Hospital found no improvement in survival when they compared novice surgeons to experts 3 1 Transport speed A study from 10 trauma hospitals in North America found no improvement in survival with faster transport times 2 Resident working hours Restriction of resident working hours did not improve outcomes • Haut ER, et al. Arch Surg 2009; 144: 759-64 • Newgard CD, et al. Ann Emerg Med 2010; 55:235-46 • Helling TS, et al. J Trauma. 2010: 69:607-12
Transfusion Options What should you put in the box? Recombinant factor VIIa 1 W Formula resuscitation 2 Fresh blood 3 Fresh warm whole blood 4 ABO identical plasma 5 Fibrinogen concentrates 6 http://ecx.images-amazon.com/images/I/31H6wFfIl7L._SL500_AA300_.jpg
RESIDENT GUIDANCE RECOMMENDED Resident guidance suggested FOR WACKY STATISTICAL METHODS Boffard KD, et al. J Trauma. 2005;59:8-15 1st RCT rVIIa • Conclusion: Recombinant FVIIa resulted in a significant reduction in RBC transfusion in severe blunt trauma. Similar trends were observed in penetrating trauma. The safety of rFVIIa was established in these trauma populations within the investigated dose range. KD Boffard, B.Riou, B.Warren et al. J.Trauma. 2005; 59:8-18
Arrivalat ER Trauma Randomisation 6 0 Trial Design Boffard KD, et al. J Trauma. 2005;59:8-15 200 ug/kg 0 100 ug/kg 1 100 ug/kg 3 rFVIIa 8 Transfusion(units RBC) Placebo n=301 2 studies (Blunt & Penetrating)
No Effect on Transfusion Rate Boffard KD, et al. J Trauma. 2005;59:8-15 * p=0.07
Survival (not ITT) Boffard KD, et al. J Trauma. 2005;59:8-15
Recombiant Factor VIIa - CONTROL Hauser CJ, et al. J Trauma 2010; 69: 489-500 • Prospective, randomized, double-blinded, multicenter trial (150 hospitals in 26 countries) • 3 doses r7a 200/100/100 ug/kg - $30K • Up to age 70 • Still bleeding with shock/hypotension/acidosis after 4 units RBC
Recombinant Factor VIIa - CONTROL Hauser CJ, et al. J Trauma 2010; 69: 489-500 • Powered to detect a 16.7% mortality reduction assuming a 30% baseline mortality • Planned interim analysis • Stopped early due to high likelihood of futility • 573 enrolled, 560 dosed, 554 in ITT • No difference in mortality (11% vs 11%)
Recombinant Factor VIIa - CONTROL Hauser CJ, et al. J Trauma 2010; 69: 489-500 • Does r7a prevents FFP transfusion which prevents RBC transfusions?
Safety Profile n= 4119 Levi M, et al. NEJM 2010; 363: 1791-1800. • Arterial TE events were more common in r7a treated patients OR 1.68 (1.2-2.4, p=0.003) • Risk attributed to patients over 65 years • 65-74 yrs – OR 2.12 (0.95-4.71, p=0.07) • >75 yrs – OR 3.02 (1.22-7.48, p=0.02)
Iraq 2003-2005Borgman et al. J Trauma 2007; 63: 805-813. • >10 units of blood (RBC/whole blood) in 24 hrs • This type of trial design may excluded severely injured patients who died before #10 • Divided patients into 3 groups based on similar ratios of FFP:RBC and mortality • Analyzed to determine the effect of the FFP:RBC ratio on mortality • Transfusion protocol not disclosed • Between 2003-05 – 5,293 admitted of whom 246 (4.6%) were included • 95% penetrating trauma
Outcomes Borgman et al. J Trauma 2007; 63: 805-813.
Their conclusion Borgman et al. J Trauma 2007; 63: 805-813. • High FFP:RBC ratio results in a 55% absolute risk reduction in mortality! • High FFP:RBC ratio decreased the hourly transfusion rate QUOTABLE “If you want to get people to believe something really, really stupid, just stick a number on it.” Author Charles Seife Proofiness: The Dark Arts of Mathematical Deception
Other Retros Delta 29%! 55% Median 26%
Of course, same goes for platelets Inaba K, et al. J Am Coll Surg 2010; 211: 573-9. Different patients: Different outcomes:
Snyder – Confirms survivorship bias J Trauma 66:358-364, 2009 • 2 way analysis: • the effect of the ratio at 24 hours on outcome • the effect of the ratio on outcome in a time-dependent analysis • Median time to the first RBC and first FFP was 18 and 93 minutes, respectively • The start times for the first FFP ranged from 24 to 350 minutes!
Snyder - Alabama J Trauma 66:358-364, 2009 0.37;0.22-0.63 0.84, 0.47-1.50
Indication Creep Mell MW, et al. Surg 2010; 148: 955-62. • Ruptured AAAs between 1987 and 2007 (note: pre 1:1 paper by Borgman) • Includes 128 patients transfused >10 units • Transfusion at the discretion of the MDs • Volume of FFP did not impact survivability • In multivariate analysis, ratio of FFP (<1:2) resulted in a 4-fold increased risk of death • Only possible mathematical conclusion – more RBCs = more deaths FFP RBC http://www.learningradiology.com/caseofweek/caseoftheweekpix/aneurysmrupture2.jpg
The pre- and post-MTP studies • Another way to look for effects on outcomes • Unfortunately: • Selection bias results in different patients between the two groups • Not the same time period – other changes to care have occurred
Military Before, After Simmons JW, et al. J Trauma 2010; 69: S75-80. • They were able to change transfusion practice
Military Before, After Simmons JW, et al. J Trauma 2010; 69: S75-80. • Formula-driven resuscitation was associated with an increased risk of MT despite no differences in baseline characteristics
Military Before, After Simmons JW, et al. J Trauma 2010; 69: S75-80. • They successfully managed patients “better” • Warmer on arrival (96.5 to 98.2°F) • Less crystalloid exposure in first 12 hours (14 vs. 9 L) • More FFP (8 to 14 U) • More platelets (1 to 2 U) • “Better” ratio (0.54 to 0.76) • Faster transport • CAT-tourniquet for every soldier • New medic resuscitation guidelines
Miltary Before, After (n=777) Simmons JW, et al. J Trauma 2010; 69: S75-80. P=0.12
TRFL – Pilot Feasibility Study 35 patients - 16 months 3 excluded 32 patients Lab = 14 patients 1:1:1 = 18 patients Lab q2h in 100% ratio 2:1:0.6 14% death (24h) 1:1:1 in 75% ratio 1.2:1:1 17% death
Fresher Blood in Trauma Spinella et al. Crit Care. 2009;13(5):R151. • Retrospective cohort 2004-07 of trauma pts admitted to ICU, civilian • Patients transfused ≥5 RBC units during admission • Compared: <27 days vs. >28 days • Matched by RBC Tx (+/- 1 unit) • Primary outcomes were deep vein thrombosis and in-hospital mortality (?)
Fresher Blood in Trauma Spinella et al. Crit Care. 2009;13(5):R151. Epub 2009 Sep 22. • 270 patients identified of whom only 202 (75%) could be matched • Patients receiving ‘older’ blood were more likely to have blunt injury (96 vs. 89%) • RBC storage age: • Maximum -19 vs. 34 days • Median - 14 vs. 20 days