Download

1 / 13
130 likes | 242 Vues
This review explores the concept of covariance in bivariate relationships, highlighting how positive covariance indicates that x tends to be greater than the mean when y is greater than the mean. The discussion includes the importance of understanding expected values conditioned on different variables, such as gender affecting height predictions. Additionally, the text explains regression equations and how they can be applied to analyze the impact of humanitarian aid on weapon spending. Various statistical measures such as slope, intercept, and standard error are also explained to enhance comprehension.

E N D
Bivariate Relationships Plotting a Line
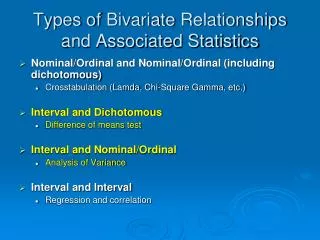
Review: Covariance • When it tends to be the case that x is greater than the mean when y is greater than the mean AND x is lower than the mean when y is lower than the mean, then there is a positive covariation
Plot showing positive covariance Mean urban % Mean female literacy
Expected value • But we may want to know more specific knowledge than that – we may want to know the expected value of y for each increased value of x • I may know the mean of everyone’s height in class • But if I know gender, then I can generate two expected values • If you remember, we are always trying to do better than the mean
Substantive effect • For every 10K dollars given in humanitarian aid, there is an increase in 3K spent on weapons • For every 10K dollars given in humanitarian aid, there is a .5K increase spent on weapons • For every 10K dollars given in humanitarian aid, there is a 8K increase spent on weapons • Unit of analysis?
Regression equation • y = a + bx + e • ŷ = a + bx • ŷ is also known as yhat • y is the dependent variable value • yhat is the predicted value • a is the intercept
X and Y • Y X • 2 1 • 2 • 4 3 • 3 4 • 6 5 • 5 6
X and Y • Y X • 2 1 • 2 • 4 3 • 3 4 • 6 5 • 5 6
ŷ= a + bx • b is slope – rise over run • a is the y intercept; constant • Standard error is the average error from the actual points to the slope • T is the ratio of the slope divided by the standard error • Beta = Pearson r in bivariate analysis
3.5 3 2.5 2 Are you happy? (mean = 1.9) 1.5 1 0.5 0 0 10 20 30 40 50 60 Occupational Prestige: (mean = 37) Life happiness = 3.33 - .038 Occupational Prestige