Download
1 / 25
250 likes | 363 Vues
Cartographers shape our perception of the world through various map projections, each introducing unique distortions when representing the three-dimensional Earth in two dimensions. From Ptolemy's ancient coordinates to modern techniques like GIS, maps serve distinct purposes. The Mercator projection favors navigation but exaggerates the sizes of areas near the poles. In contrast, the Peters projection emphasizes area accuracy. This overview explores different types of projections, the importance of map symbols, and how technology like GPS enhances our navigational capabilities.

E N D
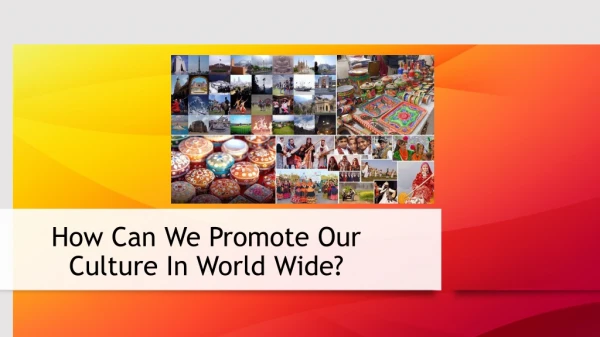
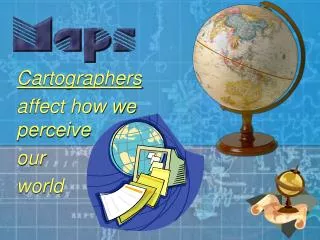
Cartographers affect how we perceive our world
Representing the earth A geographical map is a two-dimensional, geometrically accurate representation of a three-dimensional space. Inevitably, however, distortion is introduced when a globe is made to lay flat. This teacher uses a physical map of Europe to explain his point.
Ancient map Claudius Ptolemy (150 AD) map drawn from Ptolemy's coordinates for a 1482 edition of his Geographia
Types of map projections • Mercator • Mollweide • Robinson • Peters • Polar Each introduces some error inherent when three-dimensional sphere is flattened into two dimensions.
Which projection? The earth is round. The challenge of any world map is to represent a round earth on a flat surface.
Cylindrical Projection: is based on a cylinder tangent to the equator. Good for equatorial regions but greatly distorted at high latitudes.
Mercator projection Though the Mercator projection is particularly good for navigation, it becomes increasingly distorted toward the poles, resulting in areas appearing much larger than they actually are.
The distortion caused by a Mercator projection makes Greenland appear larger than Australia when, in fact, it’s one-third its size.
The Eckert projection tries to keep the countries in relative proportion but still flattens out near the poles.
The Robinson projection is based on tables of coordinates. The projection distorts shape, area, scale, and distance in an attempt to balance the errors of projection properties. The Robinson projection
Polar This projection is used by pilots to determine the shortest route between two points on the globe.
Map Symbols Compass Rose These keys should be included on any map to which they apply Scale Legend Strait Isthmus
Landsat A series of satellites that can photograph the entire earth in 16 days.
Global Positioning Systems (GPS) This system uses a series of 24 satellites called the Navstars to beam information to earth about an object and its location of the earth’s surface.
Atlas technology “Like a huge piece of orange peel that refuses to be flattened without tearing at the edges, the globe cannot be forced into two dimensions without distortion. But that distortion can now be minimised “
Geographic Information Systems (GIS) A system that uses digital map information to create a databank to produce specialized maps.
Links • http://csiss.ncgia.ucsb.edu/cookbook/images/Map%20projections.jpg • http://www.empereur.com/ptolemy.html