Download
1 / 49
490 likes | 746 Vues
DoD MWR Customer Satisfaction Results. 2009. Survey Methodology. Survey Respondents 24,920 interviews were completed and used for analysis. The resulting confidence interval is +/- 0.2 at 95% level of confidence. Interviews were conducted via the web July 29 th to August 28 th.

E N D
Survey Methodology Survey Respondents 24,920 interviews were completed and used for analysis. The resulting confidence interval is +/- 0.2 at 95% level of confidence. Interviews were conducted via the web July 29th to August 28th. All respondents were active duty Service members. Results were weighted based on the Authorized Troop Strength per the National Defense Authorization Act. 2
Respondent Profile • 81% CONUS, 19% Overseas • 84% Male, 16% Female • 75% White, 14% African American • 70% Enlisted, 26% Officer • 67% Married, 26% Single, 7% Joint Service • 58% Have children under age 20 • 33% Under 30 yrs, 42% 30 to 39 yrs, 25% 40 yrs & over • 20% Less than 5 yrs Active Duty, 19% 5 to 9 yrs, 41% 10 to 19 yrs, 20% 20 & over • 10% Currently Deployed, 60% Previously Deployed, 30% Never Deployed
DoD MWR CSI Model Program Satisfaction Libraries CSI Outcomes Single Program CSI Organizational Commitment MWRSatisfaction Automotive Skills CSI Unit Cohesion Customer Satisfaction Index (CSI) Leisure Travel CSI Retention Overall Compared to Expectations Compared to Ideal Recreation Centers CSI Readiness Outdoor Recreation CSI Fitness CSI
DoD MWR CSI Model 74 Libraries CSI(36% of respondents) 0.6 81 Organizational Commitment 73 Single Program CSI(4% of respondents*) Within the context of this study, scores in the 60s are characterized as "fine but could use work," the 70s as "good job but keep working on it" and the 80s as "excellent - keep it up.“ At the program level, as well as MWR CSI, scores in the mid-70s are expected. It is unlikely that any program will or should achieve a score greater than 85. 1.1 1.6 *6% excluding Air Force 72 Automotive Skills CSI(23% of respondents) 71 Unit Cohesion 0.3 69 Customer Satisfaction Index (CSI) 72 Leisure Travel CSI (30% of respondents) 1.7 0.8 70 Retention 72 Overall Compared to Expectations Compared to Ideal Recreation Centers CSI(8% of respondents) 1.5 1.1 67 72 Outdoor Recreation CSI(29% of respondents) Readiness Top Priority 2.3 3.8 69 Fitness CSI(84% of respondents) Top Priority 1.2 Scores Impacts 6
Calculating ImpactsA Simple Conceptual Example for a Mazda Miata
DoD MWR Priority Matrix 80 Libraries Single Program Dimension Score Recreation Automotive Leisure Centers Outdoor Skills Travel Recreation Fitness Programs 65 0.0 0.5 1.0 1.5 2.0 2.5 Top Priority Impact on Satisfaction 8
MWR CSI Total 69 Air Force 70 Army 68 Marine Corps 65 Navy 72 9
69 Fitness CSI(84% of respondents) Fitness ProgramsTop Priority Facility Programs 1.2 10
Fitness Programs Usage Characteristics of current fitness program users are very similar to the total survey population 11
Fitness Facilities and ProgramsThemes from Verbatim Comments The following are the most frequently mentioned areas of concern: Quality of facilities(e.g., appearance, cleanliness, maintenance) Hours of operation(e.g., times swimming and classes are available, seasonal availability) Availability of facilities(e.g., not too crowded or too small, open according to schedule, convenience) Availability of equipment(e.g., enough equipment for number of users, selection) Variety of classes and activities(e.g., Martial Arts, Aerobics, Triathlon) Cost of activities and services offered Quality of equipment(e.g., meets fitness needs, functions properly, general condition) 12
Fitness Programs CSI Total 69 Air Force 68 Army 68 Marine Corps 69 Navy 71 13
Fitness ProgramsTotal Impact on Fitness CSI 2.4 2.1 14
Fitness Programs – ProgramsTotal Fitness Programs - 71 Programs Fitness hours of 75 operation Helpfulness of fitness 74 staff Variety of classes (yoga, Pilates, 69 aerobics, etc.) Family exercise/fitness 67 programs Times that classes are 63 available 15
Fitness Programs – FacilityTotal Fitness Programs - 74 Facility Quality of equipment 76 Variety of facilities (e.g., basketball 74 courts, pool, running track, etc.) General condition of 74 fitness facilities Availability of 72 equipment 16
Fitness ProgramsSegment Score Differences Fitness Program CSI: 69 17 17
Outdoor RecreationTop Priority 72 Outdoor Recreation CSI(29% of respondents) 2.3 Rental Equip Activities Programs 18
Outdoor RecreationTotal Impact on Outdoor Rec CSI 1.0 2.4 1.5 19
Automotive SkillsProgram Automotive Skills - 73 Program Availability of tools 78 Having tools that are 75 up - to - date Prices and fees 75 Variety of services and 74 programs available Availability of lifts 74 Automotive hours of 66 operation Availability of paint 57 booth 23
ReadinessSegment Score Differences Readiness: 67 *From a list of 32 services and programs, respondents were asked to identify those that they use on installation, such as library, veterinary clinic, bowling center, etc. **From a list of 38 activities, respondents were asked to identify those in which they participate on installation or in the civilian community, such as golfing, gardening, going to movies, etc. 29
Key Findings 35
Key Findings Top Priorities Top Priority areas are 1) Fitness and 2) Outdoor Recreation Fitness Within Fitness, initial emphasis should be on low scoring (i.e., 60s) attributes under Programs. Fitness Facilities also need improvement. Fitness is the sole Top Priority area for those less than 25 years old. Outdoor Recreation Within Outdoor Recreation, primary focus should be on Rental Equipment. Desired Outcomes Of the four Desired Outcomes, MWR Satisfaction has the greatest impact on Readiness. 36
Next Steps 37
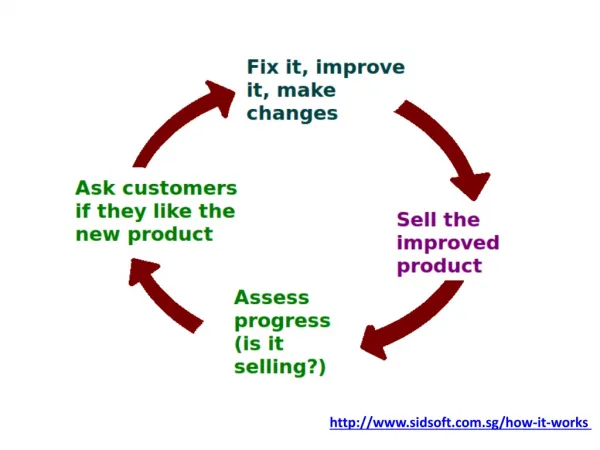
Next Steps Information Review Ensure that your decision makers, those responsible for each program, and those who are tasked with making program changes are familiar with the results Action Planning Set up action planning sessions to make sure that specific tasks and timelines are developed to address improvement opportunities Ensure that improvements that can be easily implemented (i.e., low cost, minimal effort) are made as soon as possible Survey Enhancements Learnings from the current survey will improve the quality of the next wave 38
Appendix A Under 25 Model Under 25 Priority Matrix 39
DoD MWR CSI Model - Under 25 yrs Impacts The change in the variable to the right that results from a five point change in a dimension score. 70 74 Fitness CSI (88% of respondents) Libraries CSI (42% of respondents) 0.8 *14% excluding Air Force 72 Organizational Commitment 73 Recreation Centers CSI (9% of respondents) 1.7 2.4 75 Single Program CSI (8% of respondents*) 64 Unit Cohesion 1.7 69 Customer Satisfaction Index (CSI) 73 Outdoor Recreation CSI (25% of respondents) 2.4 1.9 65 Readiness 73 Leisure Travel CSI (17% of respondents) Overall Compared to Expectations Compared to Ideal 3.9 0.9 74 Automotive Skills CSI (25% of respondents) 52 Retention 0.0 2.0 1.6 When setting priorities for improvement initiatives, scores, impacts and the percentage of personnel who participate in each program (i.e., percentage of respondents) should all be considered. *excludes Air Force respondents The performance of each dimension on a 0 to 100 scale. Dimension scores are made up of the weighted average of the corresponding survey questions. Scores 40
DoD MWR Priority Matrix - Under 25 yrs 80 SingleProgram Libraries AutomotiveSkills RecreationCenters LeisureTravel OutdoorRecreation Component Score FitnessPrograms 65 0.0 0.2 0.4 0.6 0.8 1.0 1.2 1.4 1.6 1.8 2.0 Top Priority Impact on Satisfaction 41 41
Appendix B Detailed DoD MWR CSI Model 42
DoD MWR CSI Model Impacts The change in the variable to the right that results from a five point change in a dimension score. 69 0.4 80 74 Fitness CSI(84% of respondents) Libraries CSI (36% of respondents) Staff 75 4.3 Facility 0.6 81 Organizational Commitment 1.9 75 72 Recreation Centers CSI(8% of respondents) Facility 74 2.8 Programs 1.1 1.6 73 1.5 78 Single Program CSI(4% of respondents) Staff 71 Unit Cohesion 73 3.4 Program 1.1 69 Customer Satisfaction Index (CSI) 72 Outdoor Recreation CSI(29% of respondents) 3.0 75 1.7 Programs 72 1.8 Staff/Policy 2.3 70 Retention 72 4.0 74 Leisure Travel CSI(30% of respondents) Overall Compared to Expectations Compared to Ideal Facility 73 0.6 1.5 Fees 0.8 73 2.4 72 Rental Equip Automotive Skills CSI(23% of respondents) 67 Readiness 73 1.0 Activities 0.3 72 1.5 Programs 3.8 2.4 74 Facility 71 2.1 Programs 1.2 When setting priorities for improvement initiatives, scores, impacts and the percentage of personnel who participate in each program (i.e., percentage of respondents) should all be considered. The performance of each dimension on a 0 to 100 scale. Dimension scores are made up of the weighted average of the corresponding survey questions. Scores 43
Appendix C CFI Group American Customer Satisfaction Index (ACSI) Score Calculation Deriving Impacts
CFI Group At a Glance Founded in 1988; Headquartered in Ann Arbor, Michigan Principals are among the world experts in constituent/ stakeholder satisfaction Offices worldwide; 150 full-time consultants and researchers 80+ clients; 150 to 180 on-going consulting projects Patented analytical system – US # 6,192,319 CFI Group methodology underpins the respected econometric tool, the American Customer Satisfaction Index Results published quarterly 45
Unique Features of the American Customer Satisfaction Index (ACSI) The only uniform measure of customer satisfaction in the U.S. economy, covering sectors accounting for about 66% of GDP Measures the quality of economic output on a quarterly basis; complementary to productivity measures and indicative of consumer spending Uses multiple-item indicators to assess drivers of satisfaction Meets the objective of explaining desired outcomes Allows for comparison across agencies Illustrates how customer satisfaction is embedded in a system of cause and effect relationships 46 46
ACSI Scores – National, Sector & IndustryQ4 2008 – Q3 2009 76.0 Utilities 73.7 E-Business 81.5 74 Internet News & Information 83 Internet Portals/Search Engines Energy Utilities 74 83 Food Manufacturing 84 Pet Food 80 Athletic Shoes 85 Personal Care & Cleaning Products 85 Soft Drinks 84 Breweries 72 Cigarettes 82 Apparel Transportation 72.6 Manufacturing/Nondurable Goods 81.5 Airlines 64 U.S. Postal Service 74 Express Delivery 82 Newspapers 63 Motion Pictures 74 Computer Software 75 Fixed Line Telephone Service 72 Wireless Telephone Service 69 Cellular Telephones 72 Cable & Satellite TV 63 Network Cable TV News 71 Information 70.2 Public Administration/ Government 67.9 68.0 Local Government 67.8 Federal Government 76 Supermarkets 74 Gasoline Stations 74 Department & Discount Stores 76 Specialty Retail Stores 78 Health & Personal Care Stores Health Care & Social Assistance 78.5 Retail Trade 75.2 Hospitals 77 Ambulatory Care 80 75 Banks 84 Credit Unions 73 Health Insurance 78 Life Insurance 81 Property & Casualty Insurance Accommodation & Food Services 78.9 Finance &Insurance 76.0 Hotels 75Full Service Restaurants 84Limited Service Restaurants 78 Personal Computers 75 Electronics (TV/VCR/DVD) 83 Major Appliances 81 Automobiles & Light Vehicles 84 Manufacturing/Durable Goods 81.6 E-Commerce 80.0 82 Retail 74 Brokerage 75 Travel Source: www.theacsi.org
A Note About Score Calculation • Attributes (questions on the survey) are typically answered on a 1-10 scale • Social science research shows 7-10 response categories are optimal • Customers are familiar with a 10 point scale • Before being reported, scores are transformed from a 1-10 to a 0-100 scale • The transformation is strictly algebraic; e.g. • The 0-100 scale simplifies reporting: • Often no need to report many, if any, decimal places • 0-100 scale is useful as a management tool Orig. (1-10) Trans. (0-100) 1 0 2 11.1 3 22.2 8 77.8 9 88.9 10 100
Deriving Impacts • Remember high school algebra? The general formula for a line is: y = mx + b • The basic idea is that x is a “cause” and y is an “effect”, and m represents the slope of the line – summarizing the relationship between x & y • CFI Group uses a sophisticated variation of the advanced statistical tool, Partial Least Squares (PLS) Regression, to determine impacts when many different causes (i.e., quality components) simultaneously effect an outcome (e.g., Customer Satisfaction)