Statistics in Research Methods: Hypothesis Testing and Statistical Analysis
Learn about hypothesis testing and statistical analysis in research methods, including t-tests and analysis of variance (ANOVA). Understand how to interpret results and make informed decisions based on statistical tests.


Statistics in Research Methods: Hypothesis Testing and Statistical Analysis
E N D
Presentation Transcript
Statistics (cont.) Psych 231: Research Methods in Psychology
Due today • Journal Summary 2 assignment • Descriptive and inferential statistics exercises • Class experiment final draft (Adam’s sections) • No labs this week • Use your time to work on posters of the group projects • Poster sessions are last lab sections of the semester (last week of classes), so start thinking about your posters. I will lecture about poster presentations on Monday. Announcements
Step 2: Set your decision criteria • Step 3: Collect your data from your sample(s) • Step 4: Compute your test statistics • Step 5: Make a decision about your null hypothesis • “Reject H0” – there is a statistically significant difference • “Fail to reject H0” – there is not a statistically significant difference • Step 1: State your hypotheses Testing Hypotheses
TR + ID + ER ID + ER XA XB • The generic test statistic - is a ratio of sources of variability • ER: Random sampling error • ID: Individual differences (if between subjects factor) • TR: The effect of a treatment Observed difference Computed test statistic = = Difference from chance “Generic” statistical test
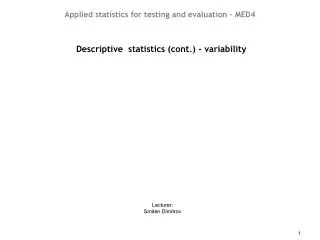
X Population Distribution of sample means Sample σ s μ “chance” Avg. Sampling error Difference from chance
Test statistic TR + ID + ER ID + ER • The generic test statistic distribution • To reject the H0, you want a computed test statistics that is large • reflecting a large Treatment Effect (TR) • What’s large enough? The alpha level gives us the decision criterion Distribution of the test statistic Distribution of sample means α-level determines where these boundaries go “Generic” statistical test
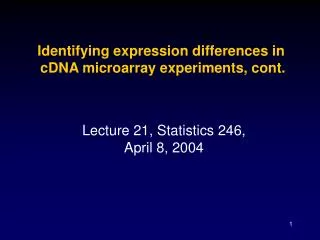
The generic test statistic distribution • To reject the H0, you want a computed test statistics that is large • reflecting a large Treatment Effect (TR) • What’s large enough? The alpha level gives us the decision criterion Distribution of the test statistic Reject H0 2.5% 2.5% “two-tailed” with α = 0.05 Fail to reject H0 “Generic” statistical test
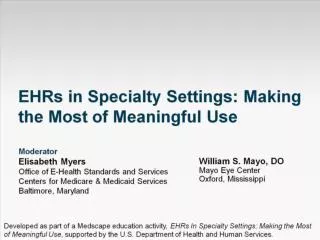
The generic test statistic distribution • To reject the H0, you want a computed test statistics that is large • reflecting a large Treatment Effect (TR) • What’s large enough? The alpha level gives us the decision criterion Distribution of the test statistic Reject H0 “One tailed test”: sometimes you know to expect a particular difference (e.g., “improve memory performance”) 5.0% “one-tailed” with α = 0.05 Fail to reject H0 “Generic” statistical test
TR + ID + ER ID + ER • Things that affect the computed test statistic • Size of the treatment effect • The bigger the effect, the bigger the computed test statistic • Difference expected by chance (sample error) • Variability in the population • Sample size “Generic” statistical test
1 factor with two groups • T-tests • Between groups: 2-independent samples • Within groups: Repeated measures samples (matched, related) • 1 factor with more than two groups • Analysis of Variance (ANOVA) (either between groups or repeated measures) • Multi-factorial • Factorial ANOVA Some inferential statistical tests
Observed difference X1 - X2 T = Diff by chance Based on sample error • Design • 2 separate experimental conditions • Degrees of freedom • Based on the size of the sample and the kind of t-test • Formula: Computation differs for between and within t-tests T-test
Reporting your results • The observed difference between conditions • Kind of t-test • Computed T-statistic • Degrees of freedom for the test • The “p-value” of the test • “The mean of the treatment group was 12 points higher than the control group. An independent samples t-test yielded a significant difference, t(24) = 5.67, p < 0.05.” • “The mean score of the post-test was 12 points higher than the pre-test. A repeated measures t-test demonstrated that this difference was significant significant, t(12) = 5.67, p < 0.05.” T-test
XA XC XB • Designs • More than two groups • 1 Factor ANOVA, Factorial ANOVA • Both Within and Between Groups Factors • Test statistic is an F-ratio • Degrees of freedom • Several to keep track of • The number of them depends on the design Analysis of Variance
Observed variance F-ratio = XA XC XB Variance from chance • More than two groups • Now we can’t just compute a simple difference score since there are more than one difference • So we use variance instead of simply the difference • Variance is essentially an average difference Analysis of Variance
XA XC XB • 1 Factor, with more than two levels • Now we can’t just compute a simple difference score since there are more than one difference • A - B, B - C, & A - C 1 factor ANOVA
The ANOVA tests this one!! Do further tests to pick between these XA = XB = XC XA ≠ XB ≠ XC XA ≠ XB = XC XA = XB ≠ XC XA = XC ≠ XB XA XC XB Null hypothesis: H0: all the groups are equal Alternative hypotheses • HA: not all the groups are equal 1 factor ANOVA
XA ≠ XB ≠ XC XA ≠ XB = XC XA = XB ≠ XC XA = XC ≠ XB • Planned contrasts and post-hoc tests: • - Further tests used to rule out the different Alternative hypotheses Test 1: A ≠ B Test 2: A ≠ C Test 3: B = C 1 factor ANOVA
Reporting your results • The observed differences • Kind of test • Computed F-ratio • Degrees of freedom for the test • The “p-value” of the test • Any post-hoc or planned comparison results • “The mean score of Group A was 12, Group B was 25, and Group C was 27. A 1-way ANOVA was conducted and the results yielded a significant difference, F(2,25) = 5.67, p < 0.05. Post hoc tests revealed that the differences between groups A and B and A and C were statistically reliable (respectively t(1) = 5.67, p < 0.05 & t(1) = 6.02, p <0.05). Groups B and C did not differ significantly from one another” 1 factor ANOVA
We covered much of this in our experimental design lecture • More than one factor • Factors may be within or between • Overall design may be entirely within, entirely between, or mixed • Many F-ratios may be computed • An F-ratio is computed to test the main effect of each factor • An F-ratio is computed to test each of the potential interactions between the factors Factorial ANOVAs
Reporting your results • The observed differences • Because there may be a lot of these, may present them in a table instead of directly in the text • Kind of design • e.g. “2 x 2 completely between factorial design” • Computed F-ratios • May see separate paragraphs for each factor, and for interactions • Degrees of freedom for the test • Each F-ratio will have its own set of df’s • The “p-value” of the test • May want to just say “all tests were tested with an alpha level of 0.05” • Any post-hoc or planned comparison results • Typically only the theoretically interesting comparisons are presented Factorial ANOVAs