Download
1 / 29
290 likes | 312 Vues
This curriculum explores the merits and advantages of a randomization-based approach to statistical inference through three examples. It addresses five key questions and discusses assessment issues. The curriculum is designed to simplify the logic of inference and improve understanding.

E N D
Concepts of Statistical Inference: A Randomization-Based Curriculum Allan Rossman, Beth Chance, John Holcomb Cal Poly – San Luis Obispo, Cleveland State University
Outline • Overview, motivation • Three examples • Merits, advantages • Five questions • Assessment issues • Conclusions, lessons learned • Q&A 2 CAUSE Webinar April 2009
Ptolemaic Curriculum? “Ptolemy’s cosmology was needlessly complicated, because he put the earth at the center of his system, instead of putting the sun at the center. Our curriculum is needlessly complicated because we put the normal distribution, as an approximate sampling distribution for the mean, at the center of our curriculum, instead of putting the core logic of inference at the center.” – George Cobb (TISE, 2007) 3
Is randomization-based approach feasible? • Experience at post-calculus level • Developed spiral curriculum with logic of inference (Fisher’s Exact Test) in chapter 1 • ISCAM: Investigating Statistical Concepts, Applications, and Methods • New project • Rethinking for lower mathematical level • More complete shift, including focus on entire statistical process as a whole 4
Example 1: Helper/hinderer? • Sixteen infants were shown two videotapes with a toy trying to climb a hill • One where a “helper” toy pushes the original toy up • One where a “hinderer” toy pushes the toy back down • Infants were then presented with the two toys as wooden blocks • Researchers noted which toy infants chose • http://www.yale.edu/infantlab/socialevaluation/Helper-Hinderer.html 5
Example 1: Helper/hinderer? Data: 14 of the 16 infants chose the “helper” toy Core question of inference: Is such an extreme result unlikely to occur by chance (random selection) alone … … if there were no genuine preference (null model)? 6
Analysis options Could use a binomial probability calculation We prefer a simulation approach To emphasize issue of “how often would this happen in long run?” Starting with tactile simulation 7
Strategy Students flip a fair coin 16 times Count number of heads, representing choices of “helper” toy Fair coin represent null model of no genuine preference Repeat several times, combine results See how surprising to get 14 or more heads even with “such a small sample size” Approximate (empirical) P-value Turn to applet for large number of repetitions: http://statweb.calpoly.edu/bchance/applets/BinomDist3/BinomDist.html 8
Results • Pretty unlikely to obtain 14 or more heads in 16 tosses of a fair coin, so … • Pretty strong evidence that infants do have genuine preference for helper toy and were not just picking at random
Example 2: Dolphin therapy? Subjects who suffer from mild to moderate depression were flown to Honduras, randomly assigned to a treatment Is dolphin therapy more effective than control? Core question of inference: Is such an extreme difference unlikely to occur by chance (random assignment) alone (if there were no treatment effect)? 10
Some approaches • Could calculate test statistic, P-value from approximate sampling distribution (z, chi-square) • But it’s approximate • But conditions might not hold • But how does this relate to what “significance” means? • Could conduct Fisher’s Exact Test • But there’s a lot of mathematical start-up required • But that’s still not closely tied to what “significance” means • Even though this is a randomization test 11
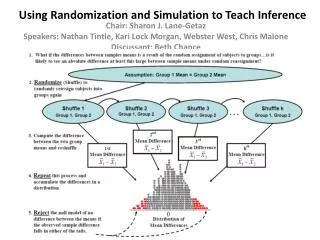
Alternative approach • Simulate random assignment process many times, see how often such an extreme result occurs • Assume no treatment effect (null model) • Re-randomize 30 subjects to two groups (using cards) • Assuming 13 improvers, 17 non-improvers regardless • Determine number of improvers in dolphin group • Or, equivalently, difference in improvement proportions • Repeat large number of times (turn to computer) • Ask whether observed result is in tail of distribution • Indicating saw a surprising result under null model • Providing evidence that dolphin therapy is more effective 12
Analysis http://www.rossmanchance.com/applets/Dolphins/Dolphins.html 13 13
Conclusion • Experimental result is statistically significant • And what is the logic behind that? • Observed result very unlikely to occur by chance (random assignment) alone (if dolphin therapy was not effective) 14
Example 3: Lingering sleep deprivation? • Does sleep deprivation have harmful effects on cognitive functioning three days later? • 21 subjects; random assignment • Core question of inference: • Is such an extreme difference unlikely to occur by chance (random assignment) alone (if there were no treatment effect)? 15
One approach • Calculate test statistic, p-value from approximate sampling distribution 16
Another approach • Simulate randomization process many times under null model, see how often such an extreme result (difference in group means) occurs 17
Advantages • You can do this at beginning of course • Then repeat for new scenarios with more richness • Spiraling could lead to deeper conceptual understanding • Emphasizes scope of conclusions to be drawn from randomized experiments vs. observational studies • Makes clear that “inference” goes beyond data in hand • Very powerful, easily generalized • Flexibility in choice of test statistic (e.g. medians, odds ratio) • Generalize to more than two groups • Takes advantage of modern computing power 18
Question #1 Should we match type of randomness in simulation to role of randomness in data collection? Major goal: Recognize distinction between random assignment and random sampling, and the conclusions that each permit Or should we stick to “one crank” (always re-randomize) in the analysis, for simplicity’s sake? For example, with 2×2 table, always fix both margins, or only fix one margin (random samples from two independent groups), or fix neither margin (random sampling from one group, then cross-classifying) 19
Question #2 What about interval estimation? Estimating effect size at least as important as assessing significance How to introduce this? Invert test Test “all” possible values of parameter, see which do not put observed result in tail Easy enough with binomial, but not as obvious how to introduce this (or if it’s possible) with 2×2 tables Alternative: Estimate +/- margin-of-error Could estimate margin-of-error with empirical randomization distribution or bootstrap distribution 20 20
Question #3 How much bootstrapping to introduce, and at what level of complexity? Use to approximate SE only? Use percentile intervals? Use bias-correction? Too difficult for Stat 101 students? Provide any helpful insights? 21 21
Question #4 What computing tools can help students to focus on understanding ideas? While providing powerful, generalizable tool? Some possibilities Java applets, Flash Very visual, contextual, conceptual; less generalizable Minitab Provide students with macros? Or ask them to edit? Or ask them to write their own? R Need simpler interface? Other packages? StatCrunch, JMP have been adding resampling capabilities 22 22
Question #5 What about normal-based methods? Do not ignore them! Introduce after students have gained experience with randomization-based methods Students will see t-tests in other courses, research literature Process of standardization has inherent value A common shape often arises for empirical randomization/sampling distributions Duh! 23 23
Assessment: Developing instruments that assess … Conceptual understanding of core logic of inference Jargon-free multiple choice questions on interpretation, effect size, etc. “Interpret this p-value in context”: probability of observed data, or more extreme, under randomness, if null model is true Ability to apply to new studies, scenarios Define null model, design simulation, draw conclusion More complicated scenarios (e.g., compare 3 groups) 24 24
Understanding of components of activity/simulation • Designed for use after an in-class activity using simulation. • Example Questions • What did the cards represent? • What did shuffling and dealing the cards represent? • What implicit assumption about the two groups did the shuffling of cards represent? • What observational units were represented by the dots on the dotplot? • Why did we count the number of repetitions with 10 or more “successes” (that is, why 10)? 25
Conducting small classroom experiments Research Questions: Start with study that has with significant result or non? Start with binomial setting or 2×2 table? Do tactile simulations add value beyond computer ones? Do demonstrations of simulations provide less value than student-conducted simulations? 26
Conclusions/Lessons Learned Put core logic of inference at center Normal-based methods obscure this logic Develop students’ understanding with randomization-based inference Emphasize connections among Randomness in design of study Inference procedure Scope of conclusions But more difficult than initially anticipated “Devil is in the details” 27 27
Conclusions/Lessons Learned Don’t overlook null model in the simulation Simulation vs. Real study Plausible vs. Possible How much worry about being a tail probability How much worry about p-value = probability that null hypothesis is true 28
Thanks very much! • Thanks to NSF (DUE-CCLI #0633349) • Thanks to George Cobb, advisory group • More information: http://statweb.calpoly.edu/csi • Draft modules, assessment instruments • Questions/comments: • arossman@calpoly.edu • bchance@calpoly.edu • j.p.holcomb@csuohio.edu 29