Download
1 / 23
390 likes | 1.91k Vues
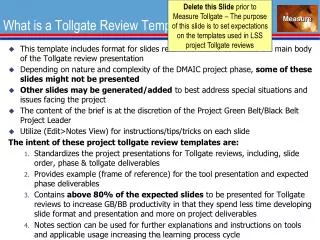
Delete this Slide prior to Measure Tollgate – The purpose of this slide is to set expectations on the templates used in LSS project Tollgate reviews. What is a Tollgate Review Template.

E N D
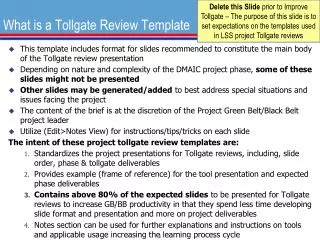
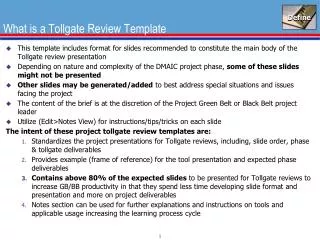
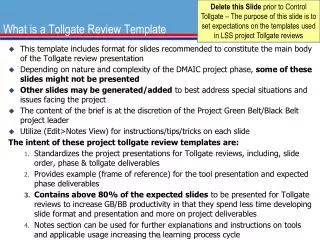
Delete this Slide prior to Measure Tollgate – The purpose of this slide is to set expectations on the templates used in LSS project Tollgate reviews What is a Tollgate Review Template • This template includes format for slides recommended to constitute the main body of the Tollgate review presentation • Depending on nature and complexity of the DMAIC project phase, some of these slides might not be presented • Other slides may be generated/added to best address special situations and issues facing the project • The content of the brief is at the discretion of the Project Green Belt/Black Belt Project Leader • Utilize (Edit>Notes View) for instructions/tips/tricks on each slide The intent of these project tollgate review templates are: • Standardizes the project presentations for Tollgate reviews, including, slide order, phase & tollgate deliverables • Provides example (frame of reference) for the tool presentation and expected phase deliverables • Contains above 80% of the expected slides to be presented for Tollgate reviews to increase GB/BB productivity in that they spend less time developing slide format and presentation and more on project deliverables • Notes section can be used for further explanations and instructions on tools and applicable usage increasing the learning process cycle
Lean Six Sigma<Project Title> <Green Belt/Black Belt Name> Project Initiation Date: <DD/MM/YY> Measure Tollgate Date: <DD/MM/YY>
Measure Measure Identify and Implement Quick Improvements with R.I.E R.I.E, 5S, NVA Analysis, Generic Pull Systems, Four Step Rapid Setup Method Lean Six SigmaDMAIC Improvement Process Road Map Update any activities or tools used in the Measure Phase of your project – Use this slide to outline Measure phase activities and tools used – delete this note before tollgate Define Analyze Improve Control Activities Tools • Identify Key Input, Process and Output Metrics • Develop Operational Definitions • Develop Data Collection Plan • Validate Measurement System • Collect Baseline Data • Determine Process Performance/Capability • Validate Business Opportunity • Value Stream Map for deeper understanding & focus • Quick Wins (Control Plans) • Measure Tollgate Review • High/Low level process Maps • Value Stream Map • Operational Definitions • Data Collection Plan • Statistical Sampling • Measurement System Analysis (MSA), Gage R&R • Constraint Identification • Setup Reduction • Generic Pull • Rapid Improvement Event • TPM • Control Charts • Process Capability, Cp & Cpk
Description Delete this Note prior to Measure Tollgate – Business Impact statement is also useful here as it should emphasize why it is important to do this project now – update for any changes from Define Phase Tollgate review. Acronyms are note recommended. • Describe the project in non-technical terms. • Define the project’s scope and boundaries (locations, products, operations, etc) • Where are we feeling the pain?
Project Charter Delete this Note prior to Measure Tollgate – Update Charter Problem/Goal Statement Business Impact Problem: Describe problem in plain English using non-technical terms • Statement should explain why project is important; why working on it is a priority Scope: Goal: Goals should communicate “before” and “after” conditions • Shift mean, variance, or both? • Should impact cost, time, quality dimensions • Express goals using SMART criteria • Specific, Measurable, Attainable, Resource Requirements, Time Boundaries • Explain leverage and strategic implications (if any) • State financial impact of project • Expenses • Investments (inventory, capital, accounts receivable ) • Revenues • Separate “hard” from “soft” dollars (Cost Reduction, Revenue Generation, Non-Quantifiable Benefits) • State financial impact of leverage opportunities (future projects) • Update the file “Financial Benefits in the financial template” Core Team Tollgate Review Schedule TollgateScheduledRevisedComplete Define: 01/18/07 - XX/XX/09 Measure: 02/14/07 XX/XX/07 XX/XX/09 Analyze: 02/28/07 XX/XX/07 XX/XX/09 Improve: 03/22/07 XX/XX/07 XX/XX/09 Control: 04/16/07 XX/XX/07 XX/XX/09 • PES Name Project Executive Sponsor (if different from PS) • PS Name Project Sponsor/Process Owner • GB/BB Name Green Belt or Black Belt Project Leader • MBB Name Master Black Belt Core Team Role % Contrib. LSS Training • Team Member 1 SME XX AT (Awareness Training) • Team Member 2 TM XX GB • Team Member 3 SME XX PS (Project Sponsor) • Team Member 4 SME XX AT Training Scheduled Extended Team • Team Member 1 Finance XX Not Trained • Team Member 2 IT XX Not Trained • Review high-level schedule milestones here: • Phase Completions • Tollgate Reviews • Trials
High/Detail-Level Swim Lane Process Map Delete this Note prior to Measure Tollgate This is an example of a swim lane diagram: Oval shapes – Start/Stop of process Diamonds – Decision points Rectangles – process steps Half-Moon – Delay/Queue Time Notify HR of employee exit date Note: Steps in blue shapes are non-value added steps Client Mgr Form require approval? Places information into HR database Sends exit date to IT, telecom & facilities Avg. Delay 2 days Re-verifies with mgr on employee’s exit status no Client HR Yes Avg. Delay 2 days Avg. Delay 2 days Secure approval(s) Sends Email to Admin Sends Email to Admin Client IT Contact Admin closes ticket and manager notified Create ticket if request coming directly from client Utilize e-mail vendor’s web tool to submit delete request to vendor ITS NT Admin Avg.Delay 1 day Generates ticket & forwards to Admin Avg. Delay 1 day Admin Avg.Delay 4 days Mark request as completed on admin web site Delete account Email Vendor
Delete this Note prior to Measure Tollgate – Select the symbols used on your Value Stream Map – Use as a backup slide or index for others Sample Value Stream Mapping Symbols I C/T = 36 Sec Quotes Machining Flow (Physical) Set Up Time 7 Min Queue/ Inventory Uptime 86% Electronic Information Flow (Information) Data Box 1 Process Box Physical Pull Electronic Data System Personnel F I F O “Go See” Monitoring FIFO Lane Truck Shipment Sign Off Point Physical Transport Paper Kanban Kanban Station Push Systems Supplier/ Customer Project Burst Supermarket Replenishment
Screen for Acct Mgr Order Mgmt Supervisor Order Mgmt CUSTOMER SUPPLIERS Service lead time = 384 min Customer call time = 24 min 2-5 days DIST Order Mgmt Order Mgmt Order Mgmt Order Mgmt 4 4 4 4 10 Delete this Note prior to Measure Tollgate – Update the Value Stream Process Map, use more slides if needed – see notes section of this slide for additional help Value Stream Map Weekly Update Phone Call Phone Call Note: Additional commonly used data box values Manual Update P/T = 3 min Lost calls=10% Volume=1200 Large Business 6 Customers Small Business Customer Info Shipping Info Product Need Pick Pack & Ship Pricing 20 Orders P/T = 2 Min P/T = 2 min P/T = 120 Min P/T = 6 Min P/T = 6 Min 5 Customers Error Rate=1% Error Rate=2% Error Rate=1% Home Error Rate=0% Error Rate=2% Volume=800 Volume=1200 Volume=800 Volume=800 Volume=800 3 Customers 5 min 240 min 3 min 2 min 6 min 6 min 2 min 120 min
Data Collection Plan Delete this Note prior to Measure Tollgate – Update with your data collection plan • For each performance measure (Y), update a data collection plan • Include MSA measure plan (Gantt Chart, MS project Plan is Optional) • Add Financial measure plan if separate from performance Y • Add any Time Study or other data collection plans for Value Stream Map • Sample Size Calculation • Use additional slides if needed
Delete this Note prior to Measure Tollgate – Update with the operational definitions that apply to your project – primarily the Y (output measure), X factor values and project terms Operational Definitions • Y – Continuous data (Process start/stop and cycle time boundaries (such as the unit of measure (eg. minutes)), the unit (the thing you are measuring), will you include weekends, holidays, non-business hours?) • Y – Discrete data (Define Success/Defect or other attribute values you will measure) • X – The subgroups values or X-factor groupings you will use on your project data collection • Other unique terms that apply to your project that require clear operational definitions • Use additional slides as needed to complete your operational definitions
MSA Delete this Note prior to Measure Tollgate – Update with MSA assessment – either qualitative (next slide) or quantitative (shown) Gage R&R %Contribution Source VarComp (of VarComp) Total Gage R&R 0.0015896 3.70 Repeatability 0.0005567 1.29 Reproducibility 0.0010330 2.40 Operator 0.0003418 0.79 Operator*Part 0.0006912 1.61 Part-To-Part 0.0414247 96.30 Total Variation 0.0430143 100.00 Study Var %Study Var Source StdDev (SD) (6 * SD) (%SV) Total Gage R&R 0.039870 0.23922 19.22 Repeatability 0.023594 0.14156 11.38 Reproducibility 0.032140 0.19284 15.50 Operator 0.018488 0.11093 8.91 Operator*Part 0.026290 0.15774 12.68 Part-To-Part 0.203531 1.22118 98.13 Total Variation 0.207399 1.24439 100.00 Number of Distinct Categories = 7 • Measurement system is acceptable with the Total % Contribution <10%
MSA Conclusions Delete this Note prior to Measure Tollgate – Update with MSA assessment – either quantitative (previous slide) or qualitative (“word” assessment of the data) [shown here] • The measurement systems are acceptable. The data is considered to have no potential for significant error. Need to be careful to appropriately use the data during the Analyze Phase. Example from BB Project
Delete this Note prior to Measure Tollgate – Normality or Graphical Summary slide to denote the shape and normality of your baseline data Baseline Basic Statistics • The current process has a non-normal distribution with the P-Value < 0.05 but does have a normal bell-shape. • Since the mean and median are the same in days (29) +/- 0.5 days, we will not transform data. • The range is 35 and the standard deviation is 2.7 days The average Delivery Time is 29.128 days +/- 2.677. This exceeds our Customer Target of 10 days.
Process Capability Delete this Note prior to Measure Tollgate – Update with your baseline process capability analysis • 266 data points collected between 11/1/04 thru 11/30/04 • Mean 29 days, St. Dev. 2.9 days, CP is 1.16 indicating process needs centering to the LSL of 10 and USL of 30 days. Cpk is .1 indicating that the process is exceeding the USL. • With an overall PPM of 371,895 defects per million opportunity, the current process has a Sigma Quality Level of 1.8 or a 62% yield
Delete this Note prior to Measure Tollgate – Use of the control chart will help indicate the stability of your data over time Control Chart • The current baseline delivery time is stable over time with both the Moving Range (3.22 days) and Individual Average (29.13 days) experiencing common cause variation • 255 data points collected with zero subgroups, thus the I&MR control chart selected
Quick Wins Delete this Note prior to Measure Tollgate – Update with a description of Quick Wins targeted or completed for your project • 5s • 4-Step Setup Reduction • Inventory Reduction • MSA Improvements • Price reductions • Reduced TIMWOOD (Non-value added steps or work) • Generic Pull System • RIE events • Other
Business Impact Delete this note once slide edits are complete – Update Projected Project Benefits (Include calculations) • State financial impact of project • Expenses • Investments (inventory, capital, A/R) • Revenues • Separate “hard” from “soft” dollars • State financial impact of future project leverage opportunities • Update the file “Financial Benefits in Your workbook”
Current Status Delete this Note prior to Measure Tollgate – Update Current Status • Key actions completed • Lean Six Sigma Tools used • Lessons learned • Communications, team building, organizational activities
Barriers/Issues Delete this Note prior to Measure Tollgate – Update Issues/Barriers from the Issues Log • Resources • Unexpected delays • Team issues • Organization issues • Other
Next Steps Delete this Note prior to Measure Tollgate – Update Next Steps Planned • Key actions • Planned Lean Six Sigma Tool use • Questions to answer • Barrier/risk mitigation activities
Stop Tollgate Review Measure Tollgate Checklist Does the team understand or has gathered the right data to help understand the process? Has the team baselined current process performance? Deliverables: • Detailed Value Stream Map(s) • Data Collection Plan • Measurement Collection Results • Process Capability Results • Quick Wins, if applicable • Identification of RIE Opportunities, if applicable • Refined Charter, as necessary • Updated Risk Mitigation Plan Green Belt/Black Belt Actions: • Deliverables Uploaded in Your workbook • Deliverables Inserted into the Project “Notebook” (see Deployment Director) • Has a more detailed Value Stream Map been completed to better understand the process and problem, and show where in the process the root causes might reside? • Has the team conducted a value-added and cycle time analysis, identifying areas where time and resources are devoted to tasks not critical to the customer? • Has the team identified the specific input (x), process (x), and output (y) measures needing to be collected for both effectiveness and efficiency categories (I.e. Quality, Speed, and Cost Efficiency measures)? • Has the team developed clear, unambiguous operational definitions for each measurement and tested them with others to ensure clarity and consistent interpretation? • Has a clear, reasonable choice been made between gathering new data or taking advantage of existing data already collected by the organization? • Has an appropriate sample size and sampling frequency been established to ensure valid representation of the process we are measuring? • Has the measurement system been checked for repeatability and reproducibility, potentially including training of data collectors? • Has the team developed and tested data collection forms or check sheets which are easy to use and provide consistent, complete data? • Has baseline performance and process capability been established? How large is the gap between current performance and the customer (or project) requirements? • Has the team been able to identify any ‘Quick Wins’? • Has the team completed the baseline savings documentation? • Have any opportunities to conduct RIE projects been identified to accelerate momentum and results? • Have ‘learnings’ to-date required modification of the Project Charter? If so, have these changes been approved by the Project Sponsor and the Key Stakeholders? • Have any new risks to project success been identified, added to the Risk Mitigation Plan, and a mitigation strategy put in place?
Enter Name Here Green Belt/Black Belt Enter Name Here Sponsor / Process Owner Enter Name Here Finance Representative Enter Name Here Champion Enter Name Here Master Black Belt Sign Off Delete this Note prior to Measure Tollgate – Update Project Signoff that project is closed and transition to Process Owner is complete • I Concur that the Measure phase was successfully completed on XX/XX/06 • I concur the project is ready to proceed to next phase: Analyze