Download
1 / 3
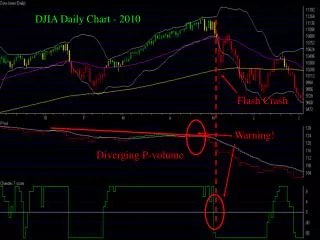
Analyzing DJIA Daily Charts: Flash Crash Warnings and Diverging P-Volume Insights
30 likes | 145 Vues
Explore the crucial insights gathered from DJIA daily charts spanning from 2010 to 2014, highlighting significant events such as the Flash Crash and the implications of diverging price volume patterns. This analysis focuses on the warnings indicated by diverging P-volume trends in the market, providing a comprehensive understanding of market behavior during critical periods. By examining these charts, investors can better recognize potential warning signals and make informed decisions in their trading strategies.
Télécharger la présentation 
Analyzing DJIA Daily Charts: Flash Crash Warnings and Diverging P-Volume Insights
An Image/Link below is provided (as is) to download presentation
Download Policy: Content on the Website is provided to you AS IS for your information and personal use and may not be sold / licensed / shared on other websites without getting consent from its author.
Content is provided to you AS IS for your information and personal use only.
Download presentation by click this link.
While downloading, if for some reason you are not able to download a presentation, the publisher may have deleted the file from their server.
During download, if you can't get a presentation, the file might be deleted by the publisher.
E N D
Presentation Transcript
DJIA Daily Chart - 2010 Flash Crash Warning! Diverging P-volume
DJIA Daily Chart - 2011 Warning! Diverging P-volume
DJIA Daily Chart - 2014 Diverging P-volume Still positive


More Related