Analyzing Toppings Preferences and Age Variability Using Graphical Representations
This document explores different methods to visualize data through bar graphs, line plots, and stem-and-leaf plots. It emphasizes appropriate labeling of axes in graphs illustrating favorite pizza toppings and age distributions. Key questions include how to interpret variability, identify data gaps, and understand probability concepts using visual tools. For instance, it examines preferred pizza toppings, the significant gap in teachers' ages, and the distribution of fat content in McDonald's breakfasts. It also discusses the necessity of legends in graphs based on data labeling.

Analyzing Toppings Preferences and Age Variability Using Graphical Representations
E N D
Presentation Transcript
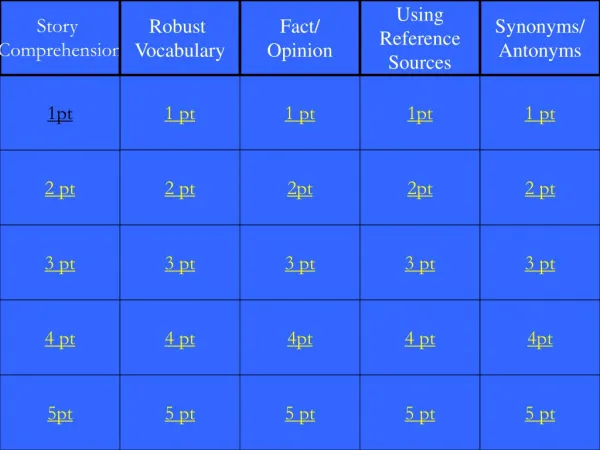
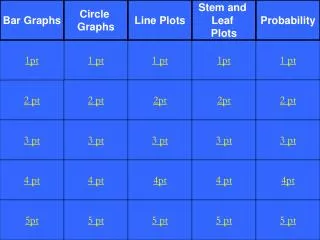
Bar Graphs Circle Graphs Line Plots Stem and Leaf Plots Probability 1pt 1 pt 1 pt 1pt 1 pt 2 pt 2 pt 2pt 2pt 2 pt 3 pt 3 pt 3 pt 3 pt 3 pt 4 pt 4 pt 4pt 4 pt 4pt 5pt 5 pt 5 pt 5 pt 5 pt
Toppings or Pizza Toppings
Number, Percent or Frequency
Favorite is Pepperoni. Least Favorite is Sausage.
Multiply .07 (or 7%) times 360 degrees.
In this graph is it necessary to have the legend? Why or why not?
This graph has the sections labeled so it is not necessary. If they were not labeled then yes it would be necessary.
Ages of people who live on your block How does this graph show variability?
Ages of people who live on your block Variability means that there is a range in scores that goes from 30 to 58.
Ages of teachers at your school Where is a large gap in the data?
Ages of teachers at your school A large gap is between 40 and 46.
Ages of teachers at your school Where is a cluster of data on this line plot?
Ages of people who live on your block The cluster is between 46 and 50.
Ages of people who live on your block Are there any outliers in the data?
Ages of people who live on your block 30 and 58 might be outliers—or points of interest that are different from most of the other points!
Ages of people who live on your block Could I have left out the numbers where there are no x’s?
Ages of people who live on your block No, you must have consistent and equal intervals.
Fat Content in McDonald’s Breakfasts • The stems stand for what place? • ones • tens • hundreds 2|3 means 23
Fat Content in McDonald’s Breakfasts How many data points are on this stem and leaf plot? 2|3 means 23
8 data points 7, 12, 14, 15, 16, 18, 23 and 36
Fat Content in McDonald’s Breakfasts • The leaves stand for what place? • ones • tens • hundreds 2|3 means 23
McDonald’s This type of Stem and Leaf plot is called a __________ |2| 3 means 23 0|2| means 20
Back-to-back Stem and Leaf Plot
McDonald’s How many data points are on this plot? |2| 3 means 23 0|2| means 20
What’s the probability of randomly drawing a red ball from the group above?
P(red) = 2/7 P (red) = red Total balls
P(not red) = 5/7 P (not red) = not red Total balls
What’s the probability of randomly drawing a red or a white ball from the group above?
P(red or white) = 5/7 P(red or white) = red or white Total balls
What’s the probability of randomly drawing a red, white or green ball from the group above?
P(red, white, or green) = 7/7 7/7 = 1 or a CERTAINTY
What’s the probability of randomly drawing a orange ball from the group above?