Analysis of Exxon Mobil and Chevron in the Integrated Oil and Gas Industry
80 likes | 226 Vues
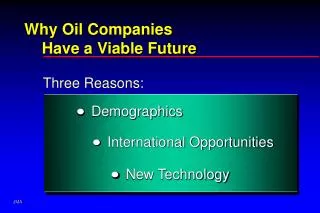
This analysis examines the dynamics of the integrated oil and gas industry, focusing on key players like Exxon Mobil and Chevron. It discusses the structure of the petroleum industry, highlighting its five operational sectors: upstream, downstream, marine, pipeline, and service/supply. The report underscores the high entry barriers and market control exerted by major players and OPEC, characterizing it as an oligopoly. Key financial metrics for both companies are provided, along with investment recommendations based on current market conditions and future outlooks for oil and gas consumption.

Analysis of Exxon Mobil and Chevron in the Integrated Oil and Gas Industry
E N D
Presentation Transcript
Exxon Mobil and Chevron Corporation Integrated Oil Companies
Industry Analysis • Petroleum Industry structure: • 5 sectors of operations (Upstream, downstream, marine, pipeline, and service/supply) • Extremely high barriers to entry allowing for sustainable profits in the long run • Supply of oil is controlled by a cartel regime (OPEC) • Economic market form is close to Oligopoly • Few large sellers dominate industry • High barriers to entry, competitors cannot enter to reduce profits of participating firms • Standardized product • Oil and Gas industry is described well by Cournot-Nash Models of competition ( Two equally positioned firms competing on quantity, not price) - Major Players (Integrated): • Exxon, Chevron, Royal Dutch Shell, British Petroleum
Chevron (CVX) Operates as an Integrated Oil Company: -Global exploration, extraction, refinement, transportation and marketing of petrol and chemical Products Market Statistics: -Market Cap (intraday)5:149.60B -Market Value Debt: 10.54 B -Enterprise Value (9-Mar-10)3:151.60B -Trailing P/E (ttm, intraday):14.22 -Price/Sales (ttm):0.94 -Price/Book (mrq):1.63
Chevron Valuation • WACC = [(D/V)*(YTM*(1-T))]+[(E/V)*(rf + β(Erm - rf)] 0.079299 • Cost of Debt = Weighted Avg. YTM (1-Marginal Tax Rate) 0.045924 • Equity = rf + β(Erm - rf) 0.081512 • Pre. Stock = Div/Price (Chevron does not have P.S.) DCF Analysis Results: • 2014 FCF $140,499.52 • Terminal Value $91,995 • PV $2,076,684.74 Millions Per Share Price Approx $ 685 Current Share Price ($74.60) • Analysts Recommendations Buys: 6 Buy/Hold: 8 Hold: 5 Hold/Sells: 0 Sells: 0
Exxon Mobil Valuation Operates as an Integrated Oil Company: -Global exploration, extraction, refinement, transportation and marketing of petrol and chemical Products Market Statistics: -Market Cap (intraday)5:316.23 B -Market Value Debt: 10.54 B -Enterprise Value (9-Mar-10)3:312.61B -Trailing P/E (ttm, intraday):16.84 -Price/Sales (ttm):1.13 -Price/Book (mrq):2.84
Exxon Mobil Valuation • WACC = [(D/V)*(YTM*(1-T))]+[(E/V)*(rf + β(Erm - rf)] 0.0615 • Cost of Debt = Weighted Avg. YTM (1-Marginal Tax Rate) 0.0330 • Equity = rf + β(Erm - rf) 0.0900 • Pre. Stock = Div/Price (Exxon Mobil does not have P.S.) DCF Analysis Results: • 2014 FCF $130,273 • Terminal Value $94,249 • PV $3,997,414 Millions • Per Share Price Approx $ 845 Current Share Price ($67.00) • Analysts Recommendations Buys: 5 Buy/Hold: 3 Hold: 10 Weak Hold: 1 Sells: 0
Future of Oil and Gas • S&P: Fundamental outlook for the Integrated Oil & Gas sub-industry for the next 12 months is positive, on expectations of improved global oil consumption amid an economic recovery. S&P projects that S&P 500 Energy sector operating EPS will drop about 67% in 2009, but rebound about 89% in 2010. • Financial Data Change in 2009 Drop In Net Income • Exxon Mobil Net Income $19,280 for 2009 vs. $45,219 for 2008 (57% drop) • Chevron Net Income $10,483 for 2009 vs. $23,931 for 2008 (56% drop)
Recommendation • Buy Exxon Mobil current price $67 • High price over past three years is $93 (April 2008) and it should head back to that level within the next 18 months with the economic recovery or 63.5% annual return • Buy Chevron current price $74.33 • High price over the past three years $99 (June 2008) and it should head back to that level within the next 18 months or 53.7% annual return