Download
1 / 71
710 likes | 959 Vues
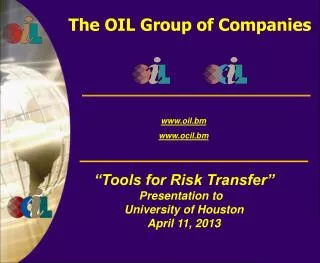
The OIL Group of Companies. www.oil.bm www.ocil.bm. “Tools for Risk Transfer” Presentation to University of Houston April 11, 2013. The Evolution of Energy Mutuals. TOPS 1993-99. sEnergy 2002-2011. OIL 1972. Traditional Insurance Market. AEGIS 1975. OCIL 1986. EIM 1986.

E N D
The OIL Group of Companies www.oil.bm www.ocil.bm “Tools for Risk Transfer” Presentation to University of Houston April 11, 2013
The Evolution of Energy Mutuals TOPS 1993-99 sEnergy 2002-2011 OIL 1972 Traditional Insurance Market AEGIS 1975 OCIL 1986 EIM 1986 NEIL 1980
Insurance Crisis # 1 Why was OIL Formed in 1971? • Inability of petroleum companies to purchase all-risk property damage coverage at realistic rates and capacity. • Incident – 1967 Explosion and Fire at Cities Service Oil Co. refinery in Lake Charles , Louisiana. • Unwillingness of the commercial insurance industry to sell third party pollution liability to petroleum companies at any price. • Incident – 1969 Union Oil Co. oil spill in Santa Barbara Channel, California. • Realization on the part of 16 oil companies that the combined capital & surplus of the petroleum industry greatly exceeded that of the insurance industry.
Insurance Crisis # 2 (1985-86) • Oil Casualty Insurance, Ltd. (OCIL) • Energy industry-owned company insuring • Excess General Liability • D&O Liability (now discontinued) • Assumed Reinsurance (Energy Industry Risks) • Formed in 1986 by 14 interested members of OIL. • Lack of D&O capacity was key driver in OCIL’s formation. • Today – 99 Shareholders and Policyholders headquartered around the world with total gross assets in excess of $3.5 Trillion.
…and again in 1993 • TOPS(Total Loss Only Platform Structures) • Petroleum industry-owned company providing high-level Excess Property Damage coverage for large production structures located in the North Sea. • Established in response to commercial insurance market’s overpricing of coverage specifically related to such structures. • Formed in 1993 by 16 petroleum companies headquartered in Europe and North America. • No losses in entire history of operations. • Liquidated in 1999 when rational pricing returned to the commercial market.
…and once again in 2002! sEnergy Insurance Limited (sEnergy) • Energy industry-owned company providing • Business Interruption • Property Damage (excess of OIL) • Lack of affordable, long-term and stable commercial market capacity was key driver in sEnergy’s formation. • Formed in 2002 by 12 energy companies. • sEnergy operated with an “OIL-like” Rating & Premium Plan. • Closed down in 2011.
OIL INSURANCE LIMITED A Case Study….
The OIL Group of Companies • Two energy industry mutual insurance companies: • Headquartered in Hamilton, Bermuda. • Established when commercial market: • Ceased to provide adequate coverages/limits. • Priced high risk energy operations at unacceptable levels. • The two companies have a total combined membership of over 121 different Shareholders/Policyholders who are world-class energy companies headquartered around the world.
Why Mutualize? • Industry ownership ensures fair treatment of Policyholders. • Being a mutual or member owned provide ‘hedge’ against a frequently volatile commercial insurance market. • Shareholders maintain active control of the coverages available to them. • Highly cost-effective catastrophe insurance facility. • Generates long-term benefits for Policyholders.
Over $2 trillion in assets insured globally for 52 members $300 million broad and stable “cornerstone” capacity $6 billion in assets Over $3.0 billion in shareholder’s equity Over $11 billion in claims paid over 40 years S&P A- rating (stable outlook) Expense ratio = approx. 3-6 % Not dependent upon reinsurance Who is OIL? World’s Largest Energy Mutual –by the numbers
OIL is an Energy Industry Mutual Insurance Company headquartered in Hamilton, Bermuda Formed by 16 major energy companies in 1972 after two incidents in the late 60’s that resulted in inadequate coverage / pricing Today, OIL is a world leader in global energy insurance 52 Shareholders / Policyholders - medium to large public / private world-class energy companies headquartered around the world 46% of membership has been with OIL for over 20 years Who is OIL? World’s Largest Energy Mutual
Why “Bermuda”? • Bermuda is one of the three largest insurance markets in the world (London and New York being the others.) • More than 1,600 international insurers and 1,200 captive insurers are registered in Bermuda. • Favorable tax/regulatory/legal environment. • Highly developed markets in all lines of insurance coverage. • Sophisticated on-Island business infrastructure.
Second largest insurance / reinsurance market in the world Over 1200 international insurers and reinsurers listed on its books Writes nearly $108 billion in gross written premium Capital & Surplus nearly $185 billion Total assets of approximately $525 billion World’s largest captive domicile Home to 600+ licensed captives Total assets over $86Bn and $21Bn in annual gross premium Location: quick access from main hubs (East Coast / London) Friendly regulatory environment Why Bermuda? Source: Bermuda Monetary Authority 2011 Annual Report
The OIL Group of Companies “Mutual/Member Owned” Structure Basic structure similar to any other corporations:- Shareholders, Board of Directors, Board Committees, Officers & Staff. Major differences: Shareholders are the Customers (Insureds.) Directors are elected from the Shareholder Body. The Investment companies are directed by a separate Board of Directors, which includes senior financial officers from major Shareholder companies. In case of OIL, no “Underwriting” per se - each Policyholder treated equitably; premiums are formula-based—”Post lost funding”.
Corporate Governance SHAREHOLDERS (Annual Meeting) Elects Board Annually BOARD OF DIRECTORS (3-5) Meetings per year) Chairman Nominates Committee members and Board Approves Executive Committee Governance Committee Audit Committee Compensation Committee OMSL MANAGEMENT All Officers and Support STAFF reside in Management Company
The OIL Group of Companies Operational Structure OCIL and OIL have no employees, The Companies are administered by Oil Management Services Ltd. Oil Management Services Ltd. (“OMSL”) Oil Casualty Insurance, Ltd. (112* members) Oil Insurance Limited (52 members) Oil Casualty Investment Corp. Ltd. (OCICL) Oil Investment Corp. Ltd. (OICL) Excess General Liability Excess Property Facultative Reinsurance Property Damage Well Control, Pollution • *112 Members at December 31, 2012 • 58 Shareholders.
OIL: An Alternative Insurance Solution • Today, OIL continues to be a very real and attractive option to many insurance buyers in the energy industry. • OIL’s $300 Million limit is one of the largest net line capacity insurers currently available to the energy industry. • OIL does not buy reinsurance so it is not subject to annual changes in conditions or restrictions on terms offered – in this way full terrorism coverage continued to be offered after September 11th. • Any rate increase in OIL is due to increased losses by the membership - not internal or external pressures - and hence is transparent.
Who are OIL’s 52 Members? • Big Companies, such as: • ConocoPhillips • TOTAL • Chevron • Small Companies, such as: • Tesoro Petroleum LOOP LLC • Murphy Oil • Electric Utility/Power Generation Companies, such as: • Electricity de France (EDF), DTE Energy • Other members of varying sizes and business focus • within the broadly-based Energy Industry.
Apache Corporation Arkema* BASF SE* BG Group plc* BHP Billiton Petroleum (Americas) Inc. Buckeye Partners, L.P. Canadian Natural Resources Ltd* Canadian Oil Sands Limited CEPSA* Chevron Corporation Chevron Phillips Chemical Company LLC CITGO Petroleum Corporation* ConocoPhillips* DONG Energy A/S* Drummond Company Inc. DTE Energy Company EDF Group* Energy Transfer Partners, L.P. ENI S.p.a.* GalpEnergia S.A.* Hess Corporation* Hovensa LLC Husky Energy Inc. LOOP LLC. Lyondell Chemical Company* Marathon Oil Company Current OIL Members Marathon Petroleum Corporation MOL Hungarian Oil and Gas Company* Murphy Oil Corporation Nexen Inc.* Noble Energy, Inc. Nova Chemicals Corporation* Occidental Petroleum Corporation* OMV Aktiengesellschaft* Paramount Resources Phillips 66 Company Puerto Rico Electric Power Authority Repsol YPF, S.A.* Royal Vopak N.V.* Santos Ltd.* Sempra Energy Sinclair Companies (The) Statoil ASA * Suncor Energy Inc. Talisman Energy Inc.* Tesoro Petroleum Corporation TOTAL* Valero Energy Corporation* Westlake Chemical Corporation Williams Companies, Inc. (The) Woodside Petroleum Limited.* Yara International ASA*
Membership “Count”* * Year-end member count, net year on year change.
OIL Shareholders by Headquarter Location 12-31-2013 Globally diversified membership with an increasing interest from non-US companies.
OIL: Risks Insured • Eight Business Sector Coverages • Physical damage to first party property. • Well Control, including Restoration and Redrilling. • Third party Pollution Liability, (non-gradual). • Limits = $300 million per occurrence, no annual aggregate. • Single Event Limit = $900 Million. • Deductibles = $10 Million minimum, increasing in $5 million increments. • WinstormCoverages: Onshore and offshore (ANWS only) • Coverage Grants same as 1, 2, and 3 above. • Limits= $150 Million p/o $250 million per occurrence • Single Event Limit = $750 Million. • Coverage is automatic for exposed assets, but member can effectively opt out of the coverage.
Automatic coverage for: Worldwide Coverage for an Energy Company and its Consolidated Subsidiaries / Affiliates A member’s interest in a JV or other non-consolidated affiliate (if interest equates to less than 1% of Gross Assets) Coverage for non-owned assets where a member has a contractual obligation to repair / replace What’s Covered?
Membership is exclusive to energy companies Members are all shareholders / policyholders and have vested interests “Mutualized” sharing of losses Easy annual renewal. Premiums are formula and performance based i.e. no underwriting One policy form for all members per the OIL Shareholders’ Agreement OIL uses gross assets from audited balance sheets while the market uses insured values OIL vs. Commercial Market
No Annual Aggregate. Joint Ventures – full Limits available. Limits do not scale for working interest but deductibles scale for interest. Aggregation Limit – maximum payout of $900 Million (non-windstorm) on multiple shareholder claims arising out of one occurrence. Reduced limits are available (minimum limit is $100M) subject to a warranty as respects the absence of other insurances (warranty does not apply to windstorm). Limits can apply as primary, excess, quota share, ventilated and different limits may be elected by sector. Oil Limits – 8 Business Sectors
For windstorm coverage outside of the ANWS zone (i.e. South China Sea, North Sea, Australia etc.), the windstorm limit is $300M (not $150M part of $250M) and the Aggregation Limit is $900M. ROW coverage, by geographic region, will be restricted only after incurring a Loss Trigger Event: A single loss event of $750M Cumulative losses of $1B over a 5 year rolling basis After a threshold trigger is met, windstorm coverage and pricing will automatically change in the next policy year unless the Board of Directors determines otherwise Rest of the World (RoW)
OIL Rating & Premium Plan Formula basis – no traditional “underwriting.” Premiums paid by Policyholders is a function of their Gross Assets. Gross Assets = Gross value (historic cost) of property, plant & equipment before deprecation, depletion, and amortization, plus inventories, materials, and supplies. Gross Assets are then adjusted for operational risk and coverage profile (i.e., sector and deductible weightings) = Weighted Gross Assets. Eight Business Sector Coverages only
Net Incurred Losses Since 1972* By Geographic Region of Physical Loss As at December 31, 2012 Expressed in billions of U.S. dollars * untrended
Sector Weighting for Risk Policyholders’ Gross Assets are adjusted to recognize differences in operational risk between Business Sectors: Offshore E&P -- Pharmaceuticals Onshore E&P -- Mining Pipelines -- Other Electric Utilities Refining & Marketing/Chemicals ANWS-Onshore ANWS-Offshore Weighted Gross Assets are used to calculate individual Policyholders premiums.
Utilizes sector and deductible weightings. Gross Assets are adjusted for operational risk (sector weighting) and coverage profile (limit/deductible weighting) to generate Weighted Gross Assets which is used to determine pool % and calculate individual premiums. 8 Business Sector Pricing(Non-Windstorm) • ELECTRIC UTILITY • PIPELINES* • MINING • OTHER*
8 Business Sector Gross Assets Unmodified Gross Assets by Industry Segment ($2,214 Bn)* Weighted Gross Assets by Industry Segment ($1,166 Bn)* * as of December 31, 2011
Premium Calculator Example - 8 Business Sector GROSS ASSETS BY BUSINESS SECTOR SECTOR / DEDUCTIBLE / LIMIT WEIGHTINGFACTORS WEIGHTED GROSS ASSETS (WGA) X X Weighting Factors Offshore E&P = 1.50 Pipelines = 0.25 Weighted Gross Factors Offshore E&P = $37.50B Pipelines = $1.25B Total = $38.75B Gross Assets Offshore E&P = $25B Pipelines = $5B Total = $30B WGA = 38.75B / $1,046B (GROUP WGA) = 3.7% MEMBERSHIP ANNUAL LOSSES (20%) ANNUAL PREMIUM X =
OIL’s History: 40 Years 1972 16 $160 Thousand $160 Thousand $48 Billion 12/31/2012 52 $3.6 Billion $5.5 Billion $2.3 Trillion Membership Shareholders’ Equity Assets Gross Assets Insured Inception To Date: Net Premiums Earned Net Losses & Loss Expense * Investment Income ** Dividends Paid *** Preference Shares Operating, Financing & Other Costs * Includes IBNR/IBNE ** Net of Interest Expense *** Excluding Preference Share dividends paid • +$13.5 Billion • - $13.8 Billion • +$ 5.2 Billion • - $ .8 Billion • +$ .4 Billion • $ .9 Billion • $ 3.6 Billion
The OIL Group: Efficiency & Control Why we are different from the Commercial Market… Commercial Market ~30-40% Expense Ratio PREMIUM Insured (Buyer) LOSS PAYMENT PREMIUM “OIL Group” ~ 5% Expense Ratio Member • LOSS PAYMENT • OWNERSHIP • CONTROL • RETURN ON • CAPITAL
Marketing • Broker Consulting Agreements • OIL has signed global service agreements with 4 key brokers to assist OIL in its efforts to attract “Quality” new members. • The services include: • Prospect Identification & Qualification. • Market Intelligence/Research • Product Development • Member opportunities/issues • Training • These agreements do not include any contingent compensation arrangements.
Marketing In 3rd year of a global marketing plan Building global broker network capabilities Oil has been “on the road” globally engaging brokers Delivering new global marketing materials Web site Brochures Tools Launching the OTA (Oil Technical Accreditation) Launched in December 2012
New On-Line Tutorial & Official Accreditation Register @ www.oil.bm “OTA” Oil Technical Accreditation
Investment Objectives • Investment objectives are to provide adequate liquidity to meet OIL’s future obligations, and endeavor to both preserve and enhance value over a market cycle. • The Investment Board reviews the investment objectives, investment policy, and asset allocation strategy at least annually.
Current Asset Allocationas at December 31, 2012 Update: as approved by the Investment Board, 25% of Global Bonds (benchmark and portfolio) were shifted to short duration on October 1, 2012. This shift was made to reduce interest rate risk, locking in gains following a period of declining interest rates and protecting against potential losses from future interest rate rises.
Historical Hurricane “Tracks” Impacting OIL Ivan $581M 121-132mph Gustav 109-115mph Ike $750M 104-109mph Rita $1,000M 121-138mph Katrina $1,000M 127-161mph