Coastal Zone Management Framework for Sustainable Preservation
Explore a comprehensive coastal zone management framework aiming at sustainable preservation of coastal functions and values by maintaining key coastal parameters. Learn about scientific results, intervention procedures, evaluation processes, and strategic objectives defining the coastal operational objectives for successful coastal management.

Coastal Zone Management Framework for Sustainable Preservation
E N D
Presentation Transcript
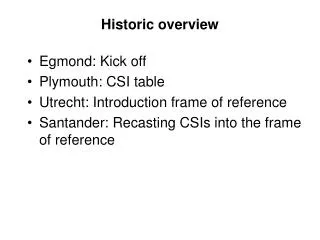
Historic overview • Egmond: Kick off • Plymouth: CSI table • Utrecht: Introduction frame of reference • Santander: Recasting CSIs into the frame of reference
3. Intervention procedure 4. Evaluation procedure • Indicators • Parameters • Monitoring • Measurement • Modelling • System knowledge IBCSI Strategic objective Defined Not defined Momentary coastline Intertidal Coastline Operational objective Defined Beach width Exceedance curves 1. Quantitative state concept 2. Benchmarking procedure Not defined X Reference state Current state
Overview Dutch presentations • Arno (RIKZ): Introduction • Aart (UU): Scientific results and CSIs • highwater line and beachwidth • storm Egmond • Stefan (WL): Scientific results and CSIs • multiyear evolution of nourished beach (beach width) • video derived observations of longshore currents • Troels (UCo): Scientific results • Arno (RIKZ): Recasting scientific results into the frame of reference
3. Intervention procedure 4. Evaluation procedure • Indicators • Parameters • Monitoring • Measurement • Modelling • System knowledge IBCSI Strategic objective Defined Not defined Momentary coastline Intertidal Coastline Operational objective Defined Beach width Exceedance curves 1. Quantitative state concept 2. Benchmarking procedure Not defined X Reference state Current state
Example: Dynamic Preservation • Strategic objective: “Sustainable preservation of functions and values in the coastal zone” • Structural erosion no longer acceptable • Operational objective: “Maintain the coastline at its 1990 position”
“Maintaining the coastline at its 1990 position” 1. Momentary CoastLine (MCL) 3. Nourishment 4. Evaluation procedure • System knowledge • State indicators • JARKUS Frame of reference: Dynamic Preservation Not OK? “Sustainable preservation of functions and values” OK? 2. Benchmarking procedure BCL TCL
Video Array y = -130 m Survey Array y = -1500 m Video-based quantification of the MCL(Subtidal Beach Mapper, Aarninkhof 2003)
Working with the Intertidal coastline • Strategic objective: • sustainable preservation of functions and values • Operational objective: • maintain the coastline at its 1990 position • QSC: • location of the coastline based on the intertidal beach volume - MICL • Benchmarking procedure: • Reference:10 year regression of MICLs to find the 1990 coastline - BICL • Test:10 year regression of MICLs to find the year T coastline - TICL • Intervention procedure: • IF the TICL exceeds the BICL THEN nourish • Evaluation procedure: • Coastline will be maintained at its 1990 position • Maybe the existing procedure is represented but ARGUS data not effectively used NAP+3m (Dunefoot) NAP-5m MCL MICL
MCL & MICL (m) Time (months) Egmond MCL (surv.) and MICL (vid.) – Raw data MCL (survey) MCL & MICL (m) MICL (video) Time (months) Egmond MCL (surv.) and MICL (vid.) – Normalized data
Working with the high water line • Strategic objective: • guarantuee sustainable safety of beach property • Operational objective: • build no property seaward of the line with a 5% exceedance probability • QSC: • probability curves of the high water line • Benchmarking procedure: • Reference: location of the 5% exceedance line • Test: exceedance percentage of desired location • Intervention procedure: • IF percentage of desired location is too high THEN relocate • Evaluation procedure: • No property built at locations with exceedance probabilities higher than 5% • Long term developments unknown(system timescale & policy timescale)
Location of the exceedence curves of the high-tide levels 2001 14-09-2001 9 GMT
Working with beach width • Strategic objective: • guarantuee sustainable recreation on the beach • Operational objective: • maintain a minimal beach width for bathing people • QSC: • width of inter tidal and supra tidal beach (waterlines) • Benchmarking procedure: • Reference: minimal beach width (to be defined by the end user - municipalities) • Test: actual beach width as measured by ARGUS • Intervention procedure: • IF actual beachwidth smaller than reference beach width THEN nourish • Evaluation procedure: • Beach width maintained constant throughout the season • Nourishments during wintertime could be inefficient
a b c d Width of the inter-tidal & supra-tidal beach Inter-tidal beach Mean width = 80 m beach width (m) Y = -250m beach width (m) Y = -500m beach width (m) Y = -750m tidal range (m) Time: 2001-2002
a b c d Supra-tidal beach Mean width = 50-60 m beach width (m) Y = -250m beach width (m) Y = -500m beach width (m) Y = -750m tidal range (m) Time: 2001-2002
This presentation was brought to you by:Arno de KruifStefan AarninkhofAart KroonTroels AagaardSusanne QuartelMark van KoningsveldDiscussion