Download
1 / 2
30 likes | 59 Vues
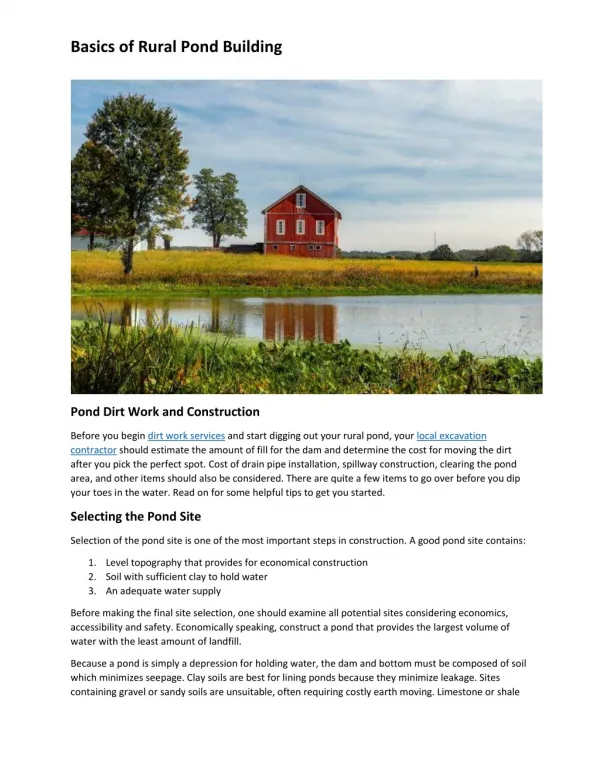
An infographic is simply a visual way to tell a story with numbers or facts. Without great facts or a great thesis, an infographic can seem disconnected and irrelevant. In this PDF author explains a short list of important things to remember when building a great infographic.<br>

E N D
How to Build A Great Infographic Infographic popularity has soared over the past 5 years, becoming a staple part of many marketing plans in the tech community. Creative firms such as JESS3 and Visual.ly have prospered due to their imaginative designs and ability to produce designs at scale. What about your small marketing team though? Not everyone has a dark back room filled with visual designers dedicated to creating the world’s best infographic, surviving off only pizza and coffee. Personally, I’ve lostcount of how often a client has asked for “A really cool infographic” hoping that I had some enlightened answer to their mysterious desire. The honest truth is that a great infographic comes from a great outline and statistical base. At it’s core, an infographic is simply a visual way to tell a story with numbers or facts. Without great facts or a great thesis, an infographic can seem disconnected and irrelevant. It helps to think of an infographic as a story, or an essay. It has a thesis, a summary, body, and conclusion – all based on research. If you view an infographic this way, it will come together more easily. “I’ve lost count of how often a client has asked for “A really cool infographic.” I’ve assembled a short list of important things to remember when building an infographic in-house: 1) Develop a thesis Many times, people simply have numbers they want to showcase, or a few points which show their value. What do these points or numbers really say about your company though? Your infographic should make a statement about something. For example, your infographic could say –“This year Justin Bieber is going to destroy his career.” This statement will be the backbone of your entire story, supporting each data point or visualization. 2) Do your research first Data should be cited at the bottom of your infographic. It is important for readers to know you did research and that your methods/diagrams are sound. Please don’t make up numbers. 3) Define your data before you draw These data sets or points will be used to create relevant visualizations in your infographic. Make sure that one leads into the next and that they seem connected, while making sure they are not redundant. An example would be –“Justin Bieber arrested 235 times, Justin Bieber throws up onstage….” This relates back to our original thesis, reinforcing our validity.
4) Don’t use cookie-cutter visuals Many people assume that infographics are made of pie charts, line graphs and bar graphs. By limiting your creativity on these specific types of visualizations, you limit the success of your infographic. These visualizations can be very abstract, or even run down the page, transitioning into one another. Try to think outside of the normal pie charts and funnel diagrams and think of new interesting ways to depict visuals while making sure the information is clear. Each visualization should add value and be connected to the overall theme. 5) Proof-read, proof-read and proof-read again The worst thing that you could do is launch something that’s not finished, or with old data, and it goes viral. People will devalue your work, and you’ll have spent hours and hours in vain. One infographic which I worked on had constantly changing data, making the entire process very difficult. If you can avoid real-time data, it might be less of a headache for your team. 6) Share it with everyone you know If there is one thing you must do with an infographic is share, share, and share. Tap into your personal networks, business networks and throw that paper airplane as far as possible. You never know who will pick it up and who will love it. A great infographic stands the test of time, and hopefully yours can do just that! With all of these points in mind, I hope you create something that you can be proud of. There is something very satisfying about creating a successful infographic and as you create more and more of them, you’ll find your own system that works best for you. Ian Douglass Co-Founder & Creative Director