Course 2
7-2. Mean, Median, Mode, and Range. Course 2. 7-2. Mean, Median, Mode, and Range. 10 20 30 40 50 60 70. Course 2. Check It Out: Example 2.

Course 2
E N D
Presentation Transcript
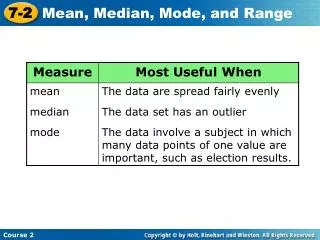
7-2 Mean, Median, Mode, and Range Course 2
7-2 Mean, Median, Mode, and Range 10 20 30 40 50 60 70 Course 2 Check It Out: Example 2 The line plot shows the number of dollars each of the 10 members of the cheerleading team raised in a week. Which measure of central tendency best describes this data? Justify your answer. XXXX XX XX X X
7-2 Mean, Median, Mode, and Range Course 2 Check It Out: Example 2 Continued The line plot shows the number of dollars each of the 10 members of the cheerleading team raised in a week. Which measure of central tendency best describes this data? Justify your answer. mean: 15 + 15 + 15 + 15 + 20 + 20 + 40 + 60 + 60 + 70 10 330 10 = = 33 The mean is 33. Most of the cheerleaders raised less than $33, so the mean does not describe the data set best.
7-2 Mean, Median, Mode, and Range Course 2 Check It Out: Example 2 Continued The line plot shows the number of dollars each of the 10 members of the cheerleading team raised in a week. Which measure of central tendency best describes this data? Justify your answer. median: 15, 15, 15, 15, 20, 20, 40, 60, 60, 70 The median is 20. The median best describes the data set because it is closest to the amount most cheerleaders raised.
7-2 Mean, Median, Mode, and Range Course 2 Check It Out: Example 2 Continued The line plot shows the number of dollars each of the 10 members of the cheerleading team raised in a week. Which measure of central tendency best describes this data? Justify your answer. mode: The greatest number of X’s occur above the number 15 on the line plot. The mode is 15. The mode focuses on one data value and does not describe the data set.
7-2 Mean, Median, Mode, and Range 10 12 14 16 18 20 22 24 26 28 30 32 34 36 38 40 42 Course 2 In the data set below, the value 12 is much less than the other values in the set. An extreme value such as this is called an outlier. 35, 38, 27, 12, 30, 41, 31, 35 x x x x x x x x
7-2 Mean, Median, Mode, and Range Course 2 Additional Example 3: Exploring the Effects of Outliers on Measures of Central Tendency The data shows Sara’s scores for the last 5 math tests: 88, 90, 55, 94, and 89. Identify the outlier in the data set. Then determine how the outlier affects the mean, median, and mode of the data. Then tell which measure of central tendency best describes the data with the outlier. 55, 88, 89, 90, 94 outlier 55
7-2 Mean, Median, Mode, and Range mean: median: mode: Course 2 Additional Example 3 Continued With the Outlier 55, 88, 89, 90, 94 outlier 55 = 416 55+88+89+90+94 55, 88, 89, 90, 94 416 5 = 83.2 The median is 89. There is no mode. The mean is 83.2.
7-2 Mean, Median, Mode, and Range mean: median: mode: Course 2 Additional Example 3 Continued Without the Outlier 55, 88, 89, 90, 94 = 361 88+89+90+94 88, 89, 90, 94 + 2 361 4 = 90.25 = 89.5 The mean is 90.25. The median is 89.5. There is no mode.
7-2 Mean, Median, Mode, and Range Caution! Since all the data values occur the same number of times, the set has no mode. Course 2
7-2 Mean, Median, Mode, and Range Without the Outlier With the Outlier mean median mode 90.25 83.2 89.5 89 no mode no mode Course 2 Additional Example 3 Continued Adding the outlier decreased the mean by 7.05 and the median by 0.5. The mode did not change. The median best describes the data with the outlier.
7-2 Mean, Median, Mode, and Range Course 2 Check It Out: Example 3 Identify the outlier in the data set. Then determine how the outlier affects the mean, median, and mode of the data. The tell which measure of central tendency best describes the data with the outlier. 63, 58, 57, 61, 42 42, 57, 58, 61, 63 outlier 42
7-2 Mean, Median, Mode, and Range mean: median: mode: Course 2 Check It Out: Example 3 Continued With the Outlier 42, 57, 58, 61, 63 outlier 42 = 281 42+57+58+61+63 42, 57, 58, 61, 63 281 5 = 56.2 The median is 58. There is no mode. The mean is 56.2.
7-2 Mean, Median, Mode, and Range mean: median: mode: Course 2 Check It Out: Example 3 Continued Without the Outlier 42, 57, 58, 61, 63 = 239 57+58+61+63 57, 58, 61, 63 + 2 239 4 = 59.75 = 59.5 The mean is 59.75. The median is 59.5. There is no mode.
7-2 Mean, Median, Mode, and Range Without the Outlier With the Outlier mean median mode 59.75 56.2 59.5 58 no mode no mode Course 2 Check It Out: Example 3 Continued Adding the outlier decreased the mean by 3.55 and decreased the median by 1.5. The mode did not change. The median best describes the data with the outlier.
7-2 Mean, Median, Mode, and Range Course 2 Lesson Quiz: Part II 2. Identify the outlier in the data set, and determine how the outlier affects the mean, median, and mode of the data. Then tell which measure of central tendency best describes the data with and without the outlier. Justify your answer. 85, 91, 83, 78, 79, 64, 81, 97 The outlier is 64. Without the outlier the mean is 85, the median is 83, and there is no mode. With the outlier the mean is 82, the median is 82, and there is no mode. Including the outlier decreases the mean by 3 and the median by 1, there is no mode. Because they have the same value and there is no outlier, the median and mean describes the data with the outlier. The median best describes the data without the outlier because it is closer to more of the other data values than the mean.