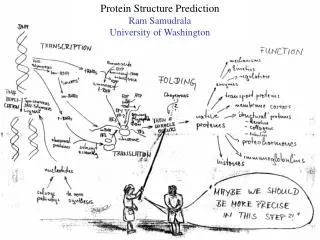
DNA/Protein structure-function analysis and prediction
DNA/Protein structure-function analysis and prediction. Protein Structure Determination: X-ray Diffraction (Titia Sixma, NKI) Electron Microscopy/Diffraction (Titia Sixma, NKI) NMR Spectroscopy (Lorna Smith, Oxford) Other Spectroscopic methods. Spectroscopy: The whole spectrum.

DNA/Protein structure-function analysis and prediction
E N D
Presentation Transcript
DNA/Protein structure-function analysis and prediction • Protein Structure Determination: • X-ray Diffraction (Titia Sixma, NKI) • Electron Microscopy/Diffraction (Titia Sixma, NKI) • NMR Spectroscopy (Lorna Smith, Oxford) • Other Spectroscopic methods
DNA/Protein structure-function analysis and prediction • Protein Structure Determination: • X-ray Diffraction • Electron Microscopy/Diffraction • NMR Spectroscopy • Other Spectroscopic methods
Phase problem Crystallization Structure determination method X-ray crystallography Purified protein Crystal X-ray Diffraction Electron density 3D structure Biological interpretation
Protein crystals • Regular arrays of protein molecules • ‘Wet’: 20-80% solvent • Few crystal contacts • Protein crystals contain active protein • Enzyme turnover • Ligand binding Example of crystal packing
Examples of crystal packing Acetylcholinesterase ~68% solvent 2 Glycoprotein I ~90% solvent (extremely high!)
hydrophilic Lipid bilayer Flexible hydrophobic hydrophilic Flexible and heterogeneous!! Problematic proteins • Multiple domains • Similarly, floppy ends may hamper crystallization: change construct • Membrane proteins • Glycoproteins
Liq.N2 gas stream X-ray source beam stop detector goniometer Experimental set-up • Options for wavelength: • monochromatic, polychromatic • variable wavelength
Diffuse scattering (from the fibre loop) Water ring Direct beam Beam stop Reflections (h,k,l) with I(h,k,l) Increasing resolution Diffraction image reciprocal lattice (this case hexagonal)
The rules for diffraction: Bragg’s law • Scattered X-rays reinforce each other only when Bragg’s law holds: Bragg’s law: 2dhkl sin q = nl
Phase Problem • If phases hkl and structure factor F(hkl) known: • compute the electron density (x,y,z) • In the electron density build the atomic 3D model • However, the phases hkl are unknown !
FK, H FH, K How important are these phases ?? FH, H FK, K • Fourier transform photo’s of Karle (top left) and Hauptman (top right) (two crystallography pioneers) • Combine amplitudes FKwith phase aH and inverse-fourier transform • Combine amplitudes FHwith phase aK and inverse-fourier transform (Taken from: Randy J. Read)
How can we solve the Phase Problem ? • Direct Methods • small molecules and small proteins • needs atomic resolution data (d < 1.2 Å) ! • Difference method using heavy atoms • multiple isomorphous replacement (MIR) • anomalous scattering (AS) • combinations (SIRAS,MIRAS) • Difference method using variable wavelength • multiple-wavelength anomalous diffraction (MAD) • Using a homologous structure • molecular replacement
Building a protein model • Find structural elements: • -helices, -strands • Fit amino-acid sequence
Building a protein model • Find structural elements: • -helices, -strands • Fit amino-acid sequence
d = 4 Å Effects of resolution on electron density Note: map calculated with perfect phases
d = 3 Å Effects of resolution on electron density Note: map calculated with perfect phases
d = 2 Å Effects of resolution on electron density Note: map calculated with perfect phases
d = 1 Å Effects of resolution on electron density Note: map calculated with perfect phases
Refinement process • Bad phasespoor electron density maperrors in the protein model • Interpretation of the electron density map improved modelimproved phasesimproved map even better model … iterative process of refinement
Validation • Free R-factor (cross validation) • Number of parameters/ observations • Ramachandran plot • Chemically likely (WhatCheck) • Hydrophobic inside, hydrophilic outside • Binding sites of ligands, metals, ions • Hydrogen-bonds satisfied • Chemistry in order • Final B-factor values
DNA/Protein structure-function analysis and prediction • Protein Structure Determination: • X-ray Diffraction • Electron Microscopy/Diffraction • NMR Spectroscopy • Other Spectroscopic methods
Electron microscopy • Single particle • Low resolution, not really atomic • Less purity of protein, more transient state analysis • Two-dimensional crystals • Suited to membrane proteins • Fibres • Acetylcholine receptor • Muscles, kinesins and tubulin • Preserve protein by • Negative stain (envelope only) • Freezing in vitreous ice (Cryo-EM, true density maps) • High resolution possible but difficult to achieve • For large complexes: Combine with X-ray models
Electron diffraction from 2D crystals: Nicotinic Acetylcholine Receptor G-protein coupled receptors Unwin et al, 2005
Electron diffraction: near atomic resolution • Structure of the alpha beta tubulin dimer by electron crystallography. Nogales E, Wolf SG, Downing KH. Nature 1998 391 199-203
Single particle Electron Microscopy Select particles Sort into classes Average Reconstruct 3D image
Cryo EM reconstruction:Tail of bacteriophage T4 Leiman et al. Cell. 2004 Aug 20;118(4):419-29
DNA/Protein structure-function analysis and prediction • Protein Structure Determination: • X-ray Diffraction • Electron Microscopy/Diffraction • NMR Spectroscopy • Other Spectroscopic methods
1D NMR spectrum of hen lysozyme (129 residues) • Too much overlap in 1D: 2D • 1H-1H • 1H-15N • 1H-13C
R H O O H a C N C C a N C C N H O H b C H Amino acid spin system H H g C Amino acid spin system Step 1: Identification of amino acid spin systems
Val bg Val ab Thr bg Thr ab 2D COSY spectrum of peptide in D2O
a H(i)-NH(i+1) NOE NH(i)-NH(i+1) NOE a C a C b C NH(i)-NH(i+1) NOE a H(i)-NH(i+1) NOE g C Step 2: Sequential assignment R H O H N C f N C N H O H H H H
2D NOESY spectrum • Peptide sequence (N-terminal NH not observed) • Arg-Gly-Asp-Val-Asn-Ser-Leu-Phe-Asp-Thr-Gly Gly Val Gly Leu Thr Ser Phe Asn Asp Asp
Nitroreductase Dimer: 217 residues • Too much overlap in 2D: 3D • 1H-1H-15N • 1H-13C-15N
Structural information from NMR: NOEs For macromolecules such as proteins: Initial build up of NOE intensity 1/r6 Between protons that are < 5Å apart
NH-NH(i,i+1) 2.8Å aH-NH(i,i+3) 3.4Å aH-bH(i,i+3) 2.5-4.4Å Cytochrome c552 3D 1H-15N NOESY aH-NH(i,i+3) resides 38-47 form a-helix NOEs in a-helices O O H N R H O H R O H N O H H R N O H R N H H N O R H H H R O N R H O N H H H R N R H
NOEs in b-strands aH-NH(i,j) 2.3Å aH-NH(i,j) 3.2Å
Long(er) range NOEs Provide information about Packing of amino acid side chains Fold of the protein NOEs observed for CaH of Trp 28 in hen lysozyme
Spin-spin coupling constants Fine structure in COSY cross peaks For proteins 3J(HN.Ha) useful: Probes main chain f torsion angle Hen lysozyme: 10 9 R H O O H 8 f a 7 C N C C 6 f a C N C N 5 4 H Coupling constant (Hz) O H b C H 3 H H g C 2 120 0 20 40 60 80 100 140 Residue number
Structural information from NMR3. Hydrogen exchange rates Dissolve protein in D2O and record series of spectra Backbone NH (1H) exchange with water (2H) Slow exchange for NH groups In hydrogen bonds Buried in core of protein After 20 mins After 68 hours 1H-15N HSQC spectra for SPH15 in D2O
Structural information from NMR NOEs 1Ha - 2Hb 1.8-2.5Å (strong) 2Ha - 40HN 1.8-5.0Å (weak) 3He - 88Hg2 1.8-5.0Å (weak) 3Hd - 55Hb 1.8-3.5Å (medium) Spin-spin coupling constants 1C-2N-2Ca-2C -120+/-40° 4C-5N-5Ca-5C -60+/- 30° 5C-6N-6Ca-6C -60+/- 30° Hydrogen exchange rates 10HN-6CO 1.3-2.3Å 10N-6CO 2.3-3.3Å 11HN-7CO 1.3-2.3Å 11N-7CO 2.3-3.3Å
4 1.2 10 4 1 10 8000 6000 Total energy 4000 2000 0 10 20 30 40 50 60 70 Structure number NMR structure determination: hen lysozyme • 129 residues • ~1000 heavy atoms • ~800 protons • NMR data set • 1632 distance restraints • 110 torsion restraints • 60 H-bond restraints • 80 structures calculated • 30 low energy structures used
Solution Structure Ensemble • Disorder in NMR ensemble • lack of data ? • or protein dynamics ?
DNA/Protein structure-function analysis and prediction • Protein Structure Determination: • X-ray Diffraction • Electron Microscopy/Diffraction • NMR Spectroscopy • Other Spectroscopic methods
Ultrafast Protein Spectroscopy • Structure-sensitive technique • State of protein and substrate • Redox state • Protonation • Elektronen • Follow reactions in real-time • Why ultrafast spectroscopy? • Molecular movement: time scales of 10 fs – 1 ps (10-15 – 10-12 s) • O H stretching frequency: ~3500 cm-1 (~ 10-14 s) • Transfer or movement of proton, electron or C-atom
keto ester Excited state difference spectra of Chl and Pheo Keto and ester C=O in Chlorophyll a, Pheophytin a are redox and environmental probes
ω2’ ω2 X – C – O – H O – X O ω1 ω1’ Why is vibrational spectroscopy sensitive to structure?
H-bond response during the photocycle weaker stronger broken Replace Glu with Gln whichdonates weaker H-bond