Hybrid Multidimensional Visualizations with FlowVizMenu and Parallel Scatterplot Matrix
This paper presents three innovative hybrid multidimensional visualization techniques for network exploration: the Parallel Scatterplot Matrix (P-SPLOM), FlowVizMenu, and Attribute-Driven Layout (ADL). The P-SPLOM allows smooth transitions between scatterplot matrices and parallel coordinates, facilitating exploration along multiple graph metrics such as degree and clustering coefficient. The FlowVizMenu enables quick selection of dimensions for embedded scatterplots. Initial user feedback from bioinformaticians highlights the usefulness of these tools for network data analysis, while also presenting potential improvements in usability.

Hybrid Multidimensional Visualizations with FlowVizMenu and Parallel Scatterplot Matrix
E N D
Presentation Transcript
The FlowVizMenu and Parallel Scatterplot Matrix:Hybrid Multidimensional Visualizations for Network Exploration Christophe Viau, École de technologie supérieure, Montreal Michael J. McGuffin, École de technologie supérieure, Montreal Yves Chiricota, Université du Québec à Chicoutimi, Chicoutimi Igor Jurisica, Ontario Cancer Institute, Toronto
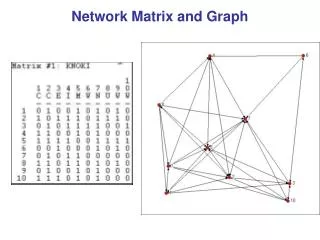
Network exploration by graph metrics • Computed metrics: • Degree
Network exploration by graph metrics • Computed metrics: • Degree • Closeness centrality • Clustering coefficient • K-core decomposition • ...
Network exploration by graph metrics • Computed metrics: • Degree • Closeness centrality • Clustering coefficient • K-core decomposition • ...
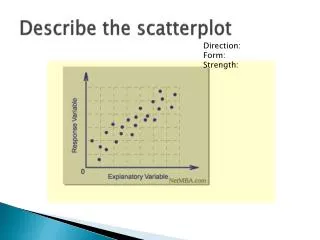
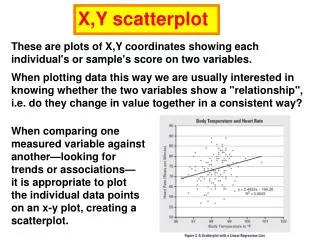
Multi-dimensional visualizations Scatterplot Matrix(SPLOM) Parallel Coordinates
Related workUsing a Scatterplot Matrix (SPLOM)and Node-Link Diagram to visualize a graph GraphDice [Bezerianos et al., 2010]
Related workIntegration of scatterplots and parallel coordinates Yuan et al., 2009 Steed et al., 2009 Holten and van Wijk, 2010
Our proposed interface Parallel Scatterplot Matrix
Our proposed interface FlowVizMenu Parallel Scatterplot Matrix
Our proposed interface Attribute-Driven Layout FlowVizMenu Parallel Scatterplot Matrix
Parallel Scatterplot Matrix (P-SPLOM) Rotating around x- or y-axes causes a transition from Scatterplot Matrix (SPLOM) to stacked Parallel Coordinates. Scatterplot Matrix(SPLOM) Parallel Coordinates
Ordering of axes within P-SPLOM Problem: traditional SPLOM ordering doesn’t yield useful parallel coordinates. Axes are repeated in each row and column Repeated axes: useless for parallel coordinates
Ordering of axes within P-SPLOM Solution: order the axes according to a Latin square. Each row and column contains each axis once. Useful parallel coordinates
Scatterplot Staircase (SPLOS)Inspired partly by quilts [Watson et al. 2008] Sequence of scatterplots:treats one dimension differently. Scatterplot Staircase (SPLOS): all dimensions treated uniformly; every adjacent pair of plots share an axis. Parallel coordinates:more difficult to judge correlations than in scatterplots[Li et al., 2010]
FlowVizMenu • Variant of a FlowMenuwith embedded visualization • Smoothly animated transitions • Brushing and linking • More thantwo dimensionspossible with PCA
FlowVizMenu In-out gesture to quicklyselect axes of scatterplot
Attribute-Driven Layout (ADL) • ADL: Layout based ona scatterplot selected in the FlowVizMenu. • The network layoutcan be a mixture of • Attribute-Driven Layout (ADL) • Manual layout • Force-directed layout
Initial user feedback Five bioinformaticians used our prototype and gave feedback. All had experience working with network data. Results: Pros: • Exploring along multiple metrics, smooth transitions,and integration of views were judged useful • All participants stated they would use the interface if it were made available to them Cons: • Some pairings of metrics within the scatterplotsmay not be useful • Too many hotkeys + button combinations in the current prototype
Contributions:Three hybrid multidimensional visualization techniques for visualizing networks
Contributions:Three hybrid multidimensional visualization techniques for visualizing networks • A Parallel Scatterplot Matrix (P-SPLOM) that transitions between a scatterplot matrix and parallel coordinates
Contributions:Three hybrid multidimensional visualization techniques for visualizing networks • A Parallel Scatterplot Matrix (P-SPLOM) that transitions between a scatterplot matrix and parallel coordinates
Contributions:Three hybrid multidimensional visualization techniques for visualizing networks • A Parallel Scatterplot Matrix (P-SPLOM) that transitions between a scatterplot matrix and parallel coordinates • A FlowVizMenu to quickly select the dimensions for an embedded scatterplot
Contributions:Three hybrid multidimensional visualization techniques for visualizing networks • A Parallel Scatterplot Matrix (P-SPLOM) that transitions between a scatterplot matrix and parallel coordinates • A FlowVizMenu to quickly select the dimensions for an embedded scatterplot
Contributions:Three hybrid multidimensional visualization techniques for visualizing networks • A Parallel Scatterplot Matrix (P-SPLOM) that transitions between a scatterplot matrix and parallel coordinates • A FlowVizMenu to quickly select the dimensions for an embedded scatterplot • An Attribute-Driven Layout to configure the graph according to a scatterplot of graph metrics
Future directions • Application to other domains • Evaluation of performance and usability • Exploration of the design space of each visualization(e.g., on a small screen)
Acknowledgments We thank our collaborators for their feedback: • SAP Business Objects • Members of Jurisica Lab at OCI • Members of the Multimedia Lab at ETS This research was funded by an SAP Business ObjectsARC Fellowship, NSERC, and the FQRNT.
Parallel Scatterplot Matrix (P-SPLOM) Rotating around x- or y-axes causes a transition from Scatterplot Matrix (SPLOM) to stacked Parallel Coordinates
Ordering of axes within P-SPLOM The traditional SPLOM ordering doesn’t produceinteresting parallel coordinates Repeated axes: useless for parallel coordinates
P-SPLOM ordering We explored variants of latin square