Download

1 / 43
450 likes | 910 Vues
Population Ecology and Ecosystems. Concepts and Applications: Chapters 40 & 43 Basic Concepts: Chapters 27 & 30. http://darwin.bio.uci.edu/~sustain/bio65/lec16/b65lec16.htm. Population Ecology. Ecology.

E N D
Population Ecologyand Ecosystems Concepts and Applications: Chapters 40 & 43 Basic Concepts: Chapters 27 & 30 http://darwin.bio.uci.edu/~sustain/bio65/lec16/b65lec16.htm
PopulationEcology Ecology Ecology: The study of how organisms interact with one another and with their environment • Certain ecological principles govern the growth and sustainability of all populations • Human populations are no exception
PopulationEcology Human Population Problems • Over 6 billion people alive • About 2 billion live in poverty • Most resources are consumed by the relatively few people in developed countries
PopulationEcology Population • A group of individuals of the same species occupying a given area • Can be described by demographics • Vital statistics such as size, density, distribution, and age structure
PopulationEcology Population Age Structure • Divide population into age categories • Population’s reproductive base includes members of the reproductive and pre-reproductive age categories
PopulationEcology Density & Distribution • Number of individuals in some specified area of habitat • Crude density information is more useful if combined with distribution data clumped nearly uniform Fig 40.2 random
PopulationEcology Mark and Recapture # marked Captured = Number released Total Captured Total Pop Determining Population Size • Direct counts are most accurate but seldom feasible • Can sample an area, then extrapolate • Capture-recapture method is used for mobile species
PopulationEcology Assumptions in Capture-Recapture • Marking has no effect on mortality • Marking has no effect on likelihood to being captured • There is no immigration or emigration between sampling times
PopulationEcology Changes in Population Size • Immigration adds individuals • Emigration subtracts individuals • Births add individuals • Deaths subtract individuals
PopulationEcology Zero Population Growth- ZPG • Interval in which number of births is balanced by number of deaths • Assume no change as a result of migration • Population size remains stable
PopulationEcology Per Capita Rates • Rates per individual • Total number of events in a time interval divided by the number of individuals • Per capita birth rate per month = Number of births per month Population size
PopulationEcology Exponential Growth Fig 40.4 • Population size expands by ever increasing increments during successive intervals • The larger the population gets, the more individuals there are to reproduce
PopulationEcology r • Net reproduction per individual per unit time • Variable combines per capita birth and death rates (assuming both constant) • Can be used to calculate rate of growth of a population
PopulationEcology Exponential Growth Equation G = rN • G is population growth per unit time • r is net reproduction per individual per unit time • N is population size
PopulationEcology Biotic Potential • Maximum rate of increase per individual under ideal conditions • Varies between species • In nature, biotic potential is rarely reached
PopulationEcology Space Food Shelter Temperature Mates Pollution Disease Limiting Factors • Any essential resource that is in short supply • All limiting factors acting on a population dictate sustainable population size
PopulationEcology Carrying Capacity (K) • Maximum number of individuals that can be sustained in a particular habitat • Logistic growth occurs when population size is limited by carrying capacity
PopulationEcology Logistic Growth Equation G = rmaxN (K-N/K) • G = population growth per unit time • rmax = maximum population growth rate per unit time • N = number of individuals • K = carrying capacity
PopulationEcology Logistic Growth • As size of the population increases, rate of reproduction decreases • When the population reaches carrying capacity, population growth ceases carrying capacity Time
PopulationEcology Overshooting Capacity • Population may temporarily increase above carrying capacity • Overshoot is usually followed by a crash; dramatic increase in deaths Fig 40.7
PopulationEcology Resetting the Carrying Capacity • Major changes in environment can change the carrying capacity of a local system Fig 40.6
PopulationEcology Density-Dependent Controls • Logistic growth equation deals with density-dependent controls • Limiting factors become more intense as population size increases • Disease, competition, parasites, toxic effects of waste products
PopulationEcology Density-Independent Controls • Factors unaffected by population density • Natural disasters or climate changes affect large and small populations alike
PopulationEcology Life History Patterns • Patterns of timing of reproduction and survivorship • Vary among species • Summarized in survivorship curves and life tables
PopulationEcology Life Table • Tracks age-specific patterns • Population is divided into age categories • Birth rates and mortality risks are calculated for each age category
PopulationEcology Survivorship Curves Fig 40.8
PopulationEcology Human Population Growth • Population now exceeds 6 billion • Rates of increase vary among countries • Average annual increase is 1.26 percent • Population continues to increase exponentially
PopulationEcology Human Population Growth 1999 1975 domestication of plants, animals 9000 B.C. (about 11,000 years ago) agriculturally based urban societies beginning of industrial, scientific revolutions Fig. 40.9, p. 695
PopulationEcology How Humans have Side-Stepped density dependent controls • Expanded into new habitats • Agriculture increased carrying capacity; use of fossil fuels aided increase • Hygiene and medicine lessened effects of density-dependent controls
PopulationEcology Population Momentum • Lowering fertility rates cannot immediately slow population growth rate. Why? • If every couple had just two children, population would still keep growing for another 60 years Future Growth • Exponential growth cannot continue forever • Breakthroughs in technology may further increase carrying capacity • Eventually, density-dependent factors will slow growth
PopulationEcology Resource Consumption • United States has 4.7 percent of the world’s population • Americans have a disproportionately large effect on the world’s resources • Per capita, Americans consume more resources and create more pollution than citizens of less developed nations
PopulationEcology Effects of Economic Development • Total fertility rates (TFRs) are highest in developing countries, lowest in developed countries • When individuals are economically secure, they are under less pressure to have large families
PopulationEcology Slowing Growth in China • World’s most extensive family planning program • Government rewards small family size, penalizes larger families, provides free birth control, abortion, sterilization • Since 1972, TFR down to 1.8 from 5.7
Community Ecology Community Ecology • Community: Populations of all species in a habitat. • Niche: Sum total of all a species activities and relationships as species do what they do. • Fundamental, Realized
Community Ecology Types of Interactions Who benefits? Spp 1 Spp 20 0Y 0Y YN NY NY N • Neutral • Commensalism • Mutualism • Competition • Predation • Parasitism
Community Ecology Competition • Competitive Exclusion • Paramecium • Resource Partitioning • Fruit eating birds, Barnacles
Community Ecology Predator-Prey Interactions • The Classic Lynx / Hare system
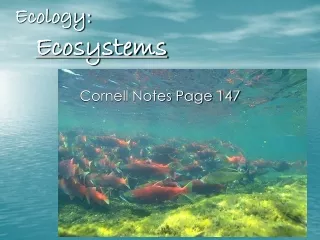
Ecosystems Ecosystems • Energy is transferred from the SUN to all organisms • Primary Producers • Consumers • Decomposers • Energy is LOST with each transition
Ecosystems Food Webs MARSH HAWK CROW HIGHER TROPHIC LEVELS Complex array of carnivores, omnivores and other consumers. Many feed at more than one trophic level continually, seasonally, or when an opportunity presents itself • A composite picture of an ecosystem’s membership and their interaction UPLAND SANDPIPER GARTER SNAKE FROG WEASEL BADGER COYOTE SPIDER SECOND TROPHIC LEVEL Primary consumers (e.g., herbivores) CLAY-COLORED SPARROW POCKET GOPHER EARTHWORMS, INSECTS (E.G., GRASSHOPPPERS, CUTWORMS) PRAIRIE VOLE GROUND SQUIRREL FIRST TROPHIC LEVEL Primary producers Fig. 43.6, p. 740 Do not post photos on Internet
Ecosystems Food Webs can be Disrupted • Natural Disasters • External inputs • Pesticides, Pollution
Ecosystems Main Reservoirs Volume (103 cubic kiometers) Oceans Polar ice, glaciers Groundwater Lakes, rivers Soil moisture Atmosphere (water vapor) 1,370,00029,000 4,000 230 67 14 The Hydrologic Cycle ATMOSPERE precipitation onto land 111,000 wind driven water vapor 40,000 evaporation from land plants (evapotranspiration) 71,000 evaporation from ocean 425,000 precipitation into ocean 385,000 surface and groundwater flow 40,000 LAND OCEAN Fig. 43.14, p. 746
Ecosystems Other Cycles • Carbon • Nitrogen • Phosphorus