Download
1 / 12
120 likes | 227 Vues
1º Congresso de Supply Chain 26/09/2008 - IBPSC– São Paulo. “ V ALUE C HAIN A NALYSIS” (Análise da Cadeia de Valor) Palestrante: Cesar Arroyo Filho. O que é Cadeia de Valor? Para que serve a Análise da Cadeia de Valor?.

E N D
1º Congresso de Supply Chain26/09/2008 - IBPSC– São Paulo “VALUE CHAIN ANALYSIS” (Análise da Cadeia de Valor) Palestrante: Cesar Arroyo Filho
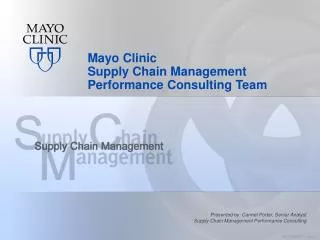
O que é Cadeia de Valor?Para que serve a Análise da Cadeia de Valor? “Análise de cadeia de valor é empreendida para entender o comportamento de custos e as fontes de diferenciação.” John Shank & Govindarajan, 1993 “Cadeia de Valor é o conjunto de atividades criadoras de valor desde as fontes de matérias primas básicas até a entrega do produto ao consumidor final”.
Swiss Watch Industry(Percentage of Worldwide Unit Production)
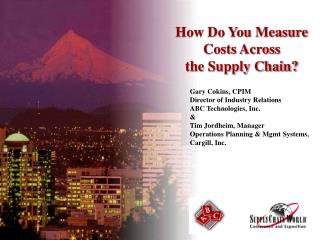
Consumer Value Profit Chain Sell out Price Cost Sell in Price A 100 120 160 B 105 135 170 / 180 C 85 120 165 / 180 D 105 150 200 E 85 115 160 E Cost C PROFIT comes from D Brand Value
Value Chain Analysis: 0,0 50,0 100,0 150,0 200,0 250,0 B A 300,0 350,0 R.M Mfg. Sales G&A Fin EBT Incent. Tax DMfg. DSales DAdm DEBT DTax
Value Chain Analysis: SUPPLIER PLANT Sell in R.M. Mfg. Sales G&A EBT Incent. Tax Price 153 49 18 14 5 19 20 27 A 117 45 19 11 4 12 6 21 B 44% 17% 7% 4% 1% 4% 2% 8% 4,3 -0,7 2,3 1,9 7,7 13,5 6,3 35,3 Diff. 4,3 3,5 5,8 7,7 15,4 28,9 35,3 23% Acc
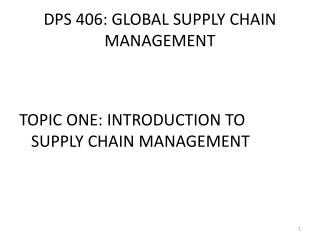
Value Chain Analysis: Sell in Sell out End User Sales KM CPK Mfg. Sales Adm EBT Tax Price Price R$/tire KM/Tire R$/000'Km Difference 306 153 36 44 21 28 25 3,06 -6% 100000 A 261 117 33 37 21 33 19 3,26 6% 80000 B 45% 13% 14% 8% 13% 7% 100% 35,3 3,1 6,6 0,0 -5,8 6,1 45 Diff. 23% 38,3 45,0 45,0 39,1 45 15% Acc
Analise da Cadeia de Valor para atingir vantagem competitiva
End User Value PerspectiveBBTS – TheThree Bags Strategy to attend End User Value perspective
Value Chain Analysis COMMODITY PRODUCT R$ 0,02 R$ 0,50 Per cup Per cup SERVICE EXPERIENCE R$ 5,00 R$ 1,50 Per cup Per cup
Obrigado cesar.arroyo@bandag .com.br