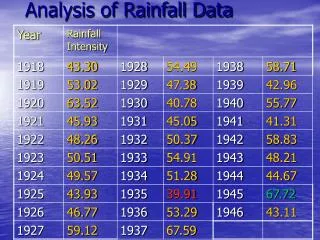
RAINFALL DATA ANALYSIS
Rainfall Snow Sleet Hails Dew Mist. Depth Duration Intensity Rainfall Frequency. Rainfall Characteristic. Types of Precipitation. The Consistency Test Of Rainfall Record Using Double Mass Curve Method. Rainfall Intensity. RAINFALL DATA ANALYSIS. Calculate. Plot Rain Hyetograph.

RAINFALL DATA ANALYSIS
E N D
Presentation Transcript
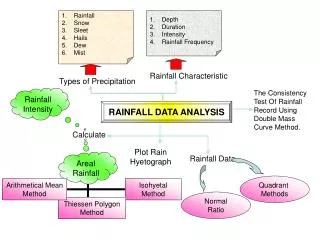
Rainfall • Snow • Sleet • Hails • Dew • Mist • Depth • Duration • Intensity • Rainfall Frequency Rainfall Characteristic Types of Precipitation The Consistency Test Of Rainfall Record Using Double Mass Curve Method. Rainfall Intensity RAINFALL DATA ANALYSIS Calculate Plot Rain Hyetograph Areal Rainfall Rainfall Data Quadrant Methods Arithmetical Mean Method Isohyetal Method Normal Ratio Thiessen Polygon Method
PRECIPITATION • is any dump or deposition in solid or liquid form that originated from the atmosphere. • Most come from the sea. • occurs when water vapor cools. • When the air reaches saturation point (also know as condensation point and dew point) the water vapor condenses and forms tiny droplet of water. • Precipitation form a 0.001% of the world’s water resources
Types of Precipitation • HORIZONTAL PRECIPITATION • Water vapour become frozen near the surface or directly on the surface • Example : dew and fog • VERTICAL PRECIPITATION • Water vapour become freezing on the air and fall to the earth • Example : rain and snow
RAINFALL • Rain is the major from precipitation in the form of water drops sizes greater than 0.5 mm. • The maximum sizes of rain drop is about 6 mm based on the intensity, rainfall is classified as light rain (>2.5mm - 5mm/hr), moderate rain (2.5 – 7 mm/hr) and heavy rain (>7.5mm/hr)
Precipitation (Rain) Formation Process Droplets Have Been Larger And Falling Down (~0.1 mm) Part Of Droplet Adding Terms Of Size Through Collision And Collection. Many Droplets Will Be Diminished Terms Of Size Through Evaporation Droplet Size Increasing Through Condensation (0.01 – 10 mm) Large Drop will Break (3 – 5 mm) Droplet Formed Rainfall (0.1 – 3 mm) Water vapor
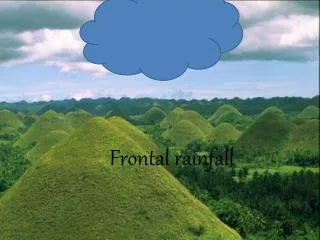
CYCLONE RAIN Stage 1 : An area of warm air meets and area of cold air Stage 2 : The warm air is forced over the cold air. Stage 3 : Where the air meets the warm air is cooled and water vapour condenses Stage 4 : Clouds form and precipitation occurs
Hurricane & Tropical Cyclone Formation Fully formed tropical cyclone with an eye, eyewall, and circulating rain bands
CONVECTIONAL RAIN Convectional precipitation results from the heating of the earth's surface that causes air to rise rapidly. As the air rises, it cools and moisture condenses into clouds and precipitation. This type of precipitation is common in the prairie provinces.
Stage 1 : The sun heats the ground and warm air rises Stage 2 : As the air rises it cools and water vapour condenses to form clouds Stage 3 : When the condensation point is reached large cumulonimbus clouds are formed Stage 4 : Heavy rain storms occur. These usually include thunder and lightening due to the electrical charge created by unstable conditions.
OROGRAPHIC PRECIPITATION Stage 1 : Warm wet air id forced to rise over high land Stage 2 : As the air rises it cools and condenses. Clouds form and precipitation occurs. Stage 3 : The drier air descends and warms Stage 4 : Any moisture in the air (e.g. cloud) evaporates
OROGRAPHIC PRECIPITATION results when warm moist air of the ocean is forced to rise by large mountains. As the air rises it cools, moisture in the air condenses and clouds and precipitation result on the windward side of the mountain while the leeward side receives very little
Placement of Rain Gauges Gauges are affected by wind pattern, eddies, trees and the gauge itself, therefore it is important to have the gauge located and positioned properly. • 1m above ground level is standard - • all gauges in a catchment should be the same height • 2 to 4 times the distance away from an isolated object (such as a tree or building) or in a forest a clearing with the radius at least the tree height or place the gauge at canopy level
Placement of Rain Gauges • shielded to protect gauge in windy sites • or if obstructions are numerous they will reduce the wind- speed, turbulence and eddies.
Placement of Rain Gauges • For sloping ground the gauge should be placed with the opening parallel to the ground • The rainfall catch volume (mm3) is then divided by the opening area that the rain can enter
Number and Distribution of Gauges Need to consider: • size of area • prevailing storm type • form of precipitation • topography • aspect • season
Snow • Snow is a form of precipitation within the Earth's atmosphere in the form of crystalline water ice, consisting of a multitude of snowflakes that fall from clouds. Since snow is composed of small ice particles, it is a granular material. It has an open and therefore soft structure, unless packed by external pressure. Snowflakes come in a variety of sizes and shapes. Types which fall in the form of a ball due to melting and refreezing, rather than a flake, are known as grapple , with ice pellets and snow grains as examples of graupel. Snowfall amount and its related liquid equivalent precipitation amount are determined using a variety of different rain gauges.
Sleet • Sleet refers to two distinct forms of precipitation: • Rain and snow mixed, snow that partially melts as it falls. (UK, Ireland and Canada) • Ice pellets, one of three forms of precipitation in a US-style "wintry mix", the other two being snow and freezing rain. (US)
Sleet Sleet forms when rain passes through a cold layer of air and freezes into ice pellets. This occurs most often in the winter when warm air is forced over a layer of cold air.
Hails • Hail is a large frozen raindrop produced by intense thunderstorms, where snow and rain can coexist in the central updraft. As the snowflakes fall, liquid water freezes onto them forming ice pellets that will continue to grow as more and more droplets are accumulated. Upon reaching the bottom of the cloud, some of the ice pellets are carried by the updraft back up to the top of the storm.
Dew • Dew is water in the form of droplets that appears on thin, exposed objects in the morning or evening. As the exposed surface cools by radiating its heat, atmospheric moisture condenses at a rate greater than that at which it can evaporate, resulting in the formation of water droplets. • When temperatures are low enough, dew takes the form of ice; this form is called frost (frost is, however, not frozen dew).
Mist/ fog • Mist is a phenomenon of small droplets suspended in air. It can occur as part of natural weather or volcanic activity, and is common in cold air above warmer water, in exhaled air in the cold, and in a steam room of a sauna. It can also be created artificially with aerosol canisters if the humidity conditions are right.
Rainfall Characteristic • Depth • Measurements in high-rainfall • Measured in mm @ cm • Measured by the hour, day, week, month and year • Duration • The period of time during which rain fell • Rain time interval fall measured in minutes and hour • Intensity • Depth of rainfall per unit time • Example: 30 mm in 3 hours; intensity = 10mm/hr • Rainfall Frequency • The frequency of rainfall occurred • Repeat for the rain • This situation can be illustrated by the rainfall that is: a) Uniform distribution: suitable for agriculture and reduce erosion • Distribution of single-mode: rainfall in the wet season • Distribution of dual mode
Rainfall Intensity • Intensity/heavy rain is the depth of rainfall per unit time • The symbol is “i” and the units are mm/hr @ cm/hr @ in/hr • Rainfall intensity equation : i = Depth rainfall Time Volume, V = Area x Depth = m3 @ ft3
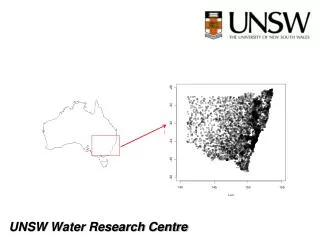
Rain Average If precipitation is nonuniform and rain gages are unevenly distributed within the area, the precipitation at each gauge may be weighted in proportion to the area the station is assumed to represent. Methods used to convert point rainfall values at different rain gauge stations into an average value over a catchment include Arithmetical Average Method Thiessen Polygon Method Isohyetal Method
Arithmetic Average Method • This technique calculates area precipitation using the arithmetic mean of all the point or area measurements considered in the analysis.
Isohyetal Method • Isohyet – It is a line joining points of equal rainfall magnitude • The catchment area is drawn to scale and the rain gauge stations are marked on it • The recorded rainfall values for which areal average is to determined are marked at the respective stations • Neighbouring stations outside the catchment are also considered • Taking point rainfall values as the guide, ishohyets of different rainfall values are drawn (similar to drawing contours based on spot levels) • The area between adjacent isohyets is measured using a planimeter. • If isohyets go out of the catchment, the catchment boundary is used as the bounding line. It is assumed that the average value of rainfall indicated by two isohyets acts over the inter isohyetal area • This method is considered superior to the previous methods when the number of raingauge stations are large