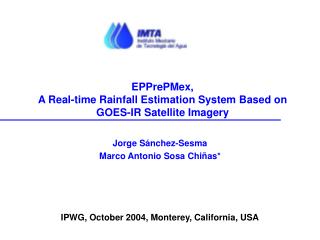
Rainfall Estimation from Satellite Data
Rainfall Estimation from Satellite Data. Beth Ebert BMRC. Satellite Applications Workshop, September 2003. Outline. Rain estimation systems Satellite rain estimation methods – how they work and when to use or not use them Geostationary (VIS/IR) Passive and active microwave


Rainfall Estimation from Satellite Data
E N D
Presentation Transcript
Rainfall Estimation fromSatellite Data Beth Ebert BMRC Satellite Applications Workshop, September 2003
Outline • Rain estimation systems • Satellite rain estimation methods – how they work and when to use or not use them • Geostationary (VIS/IR) • Passive and active microwave • Estimates using combined sensors • Accuracy of satellite rainfall estimates • Tropical Rain Potential (TRaP)
User requirements Short-term needs • Nowcasting of severe storms • Weather forecasting • Initialisation of NWP • River management • Flood control Medium-term needs • Intraseasonal variability • Agriculture Long-term needs • Climate change • Hydrological planning
Rain measurement systems - rain gauges Advantages: • “True” measurement of rain Disadvantages: • No coverage over oceans or remote regions • Point measurement not representative of area • Wind underestimates of rain • Different gauge designs
Rain measurement systems - radar Advantages: • Excellent space and time resolution • Observations in real time Disadvantages: • Little coverage over oceans or remote regions • Signal calibration • Corrections required for beam filling, bright band, anomalous propagation, attenuation, etc. • Z-R relationship • Expensive to operate
Rain estimation from model Advantages: • Excellent space and time resolution • Estimates in real time • Includes meteorological context from other model fields Disadvantages: • Forecast, not observation • Model does not represent processes perfectly
When would you use satellite rainfall estimates in real time? • When you don't have gauge or radar data • When you don't entirely trust the model • To get supporting evidence for model predictions • Typical situations: • Tropical convection • Mid-latitude convection • Storms moving on shore from sea (especially tropical cyclones)
IPWG www.isac.cnr.it/~ipwg/IPWG-nocss.html
Rain measurement systems - geostationary satellite (VIS/IR) Advantages: • Good space and time resolution • Observations in near real time • Samples oceans and remote regions • Consistent measurement system Disadvantages: • Measures cloud-top properties instead of rain • May mistake cirrus for rain clouds • Does not capture rain from warm clouds
VIS/IR rainfall estimates Principle: Rainfall at the surface is related to cloud top properties observed from space: VIS reflectivity Brighter (thicker clouds) heavier rainfall Dark no rain IR brightness temperature Colder (deeper clouds) heavier rainfall Warm no rain NIR brightness temperature |TNIR-TIR|~0 (large drops or ice) rain more likely |TNIR-TIR|>0 (small water drops) no rain
Arkin (1979) GOES Precipitation Index (GPI) Simple threshold method: R = 3.0 mm/hr * (fraction of pixels with TB 235K) • Works better over large areas and long times (i.e., monthly) • Better suited to convective rainfall
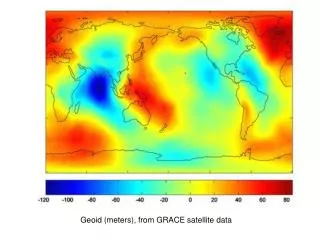
Global annual rainfall from GPI Bob Joyce, NCEP http://tao.atmos.washington.edu/data_sets/gpi/
Power law technique IR image Rain rate R = a (T0-TB)b - R0 (TB 253K)
Auto-Estimator Based on Scofield’s NESDIS Operational Convective Precipitation Estimation Technique R = Rfit* RH correction factor * growth correction factor http://orbit-net.nesdis.noaa.gov/arad/ht/ff/auto.html
GOES Multispectral Rainfall Algorithm (GMSRA) Rain indicator: VIS: a 0.40 NIR: re (eff. radius) 15 mm OR T11-T6.7: Negative for deep convective cores (T11< 230K) Rain amount: R = probability of rain(T11) * mean rain rate (T11) * RH correction factor * growth correction factor http://orbit-net.nesdis.noaa.gov/arad/ht/ff/gmsra.html
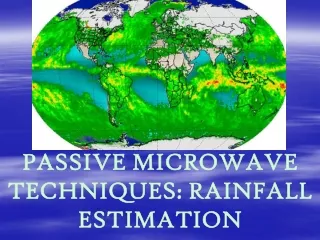
Rain measurement systems - passive microwave from polar orbiting satellite • Advantages: • Samples remote regions • Consistent measurement system • More physically based, more accurate than VIS/IR estimates • Disadvantages: • Poorer time and space resolution (~3 hr, ~5-50 km) • Not a direct measurement of rain • Beam filling • Does not capture rain from warm clouds over land
Rain measurement systems - passive microwave from polar orbiting satellite Principle: Rainfall at the surface is related to microwave emission from rain drops (low frequency channels) and microwave scattering from ice (high frequency channels): Low frequency (emission) channels - ocean only Warm many raindrops, heavy rain Cool no rain High frequency (scattering) channels Cold scattering from large ice particles, heavy rain Warm no rain Excellent reference: http://www.nrlmry.navy.mil/~kuciausk/esis/
Special Sensor Microwave Imager (SSM/I) Spatial resolution 25 km 25 km 25 km 12.5 km
Special Sensor Microwave Imager (SSM/I) OCEAN LAND Ferriday and Avery, 1994
Special Sensor Microwave Imager (SSM/I) { NOAA algorithm: SI = a0 + a1T19V + a2T22V + a3T22V2 - T85V R = a SIb http://orbit-net.nesdis.noaa.gov/arad2/ PRODUCT: RAIN RATE (mm/hr) DATA FOR JULIAN DATE 2002145 SATELLITE F15 IN ASCENDING NODE
Special Sensor Microwave Imager (SSM/I) • Profiling algorithms: • Iteratively match 7-channel TB observations to theoretical values computed from radiative transfer calculations and mesoscale cloud model (table look-up). • Use cloud model to estimate rain rate • Basis for TRMM algorithm Kummerow et al., 1994
Advanced Microwave Sounding Unit (AMSU) AMSU-A (~50 km spatial resolution): 1 23.8 GHz 2 31.4 GHz 3-14 50.3-57.29 GHz 15 89 GHz AMSU-B (~17 km spatial resolution): 1 89 GHz 2 150 GHz 3-5 ~183.3 GHz (water vapour line)
Advanced Microwave Sounding Unit (AMSU) Rain rate is based on estimated ice water path (IWP) and rain rate relation derived from the MM5 cloud model data. RR = a0 + a1 IWP + a2 IWP2 http://amsu.cira.colostate.edu/ (browse images-rain)
McIDAS – USPOL/AMSURR Updated hourly, written at 6, 18 UTC
Tropical Rain Measuring Mission (TRMM) • TRMM Microwave Imager (TMI), 780 km swath: • Band Frequency Polarization Horiz. Resol. • (GHz) (km) • 1 10.7 V, H 38.3 • 2 19.4 V, H 18.4 • 3 21.3 H 16.5 • 4 37.0 V, H 9.7 • 5 85.5 V, H 4.4 • Precipitation Radar, 220 km swath: • Horizontal resolution of 4 km • Profile of rain and snow from surface to ~20 km altitude • Use precipitation radar to tune TMI rain
Tropical Rain Measuring Mission (TRMM) “Instantaneous” rain rate http://trmm.gsfc.nasa.gov/trmmreal/
McIDAS – USPOL/TRMMRAIN Updated hourly, written at 6, 18 UTC
TRaP = (Ravg X D) V-1 1436 utc Sept 27 1998 V D Hurricane Georges DMSP SSMI Rain Rates Tropical Rainfall Potential (TRaP) http://www.ssd.noaa.gov/PS/TROP/trap-img.html
TRaP – TC Sam, December 2000 SSM/I rain rate 24 hr rain estimate
Satellites used to perform TRaP DMSP SSMI NOAA AMSU NASA TRMM NESDIS AE Resolution 15km 16km 5km 4km Frequency 1-2 per 12hrs 1 per 6-12hrs 1 per 24hrs 1 per 30min # Satellites 3 2 1 2 Max RR 35mm/hr 20mm/hr 60mm/hr 50mm/hr Priority 1 2 3 4 Slides courtesy of Sheldon Kusselson, NOAA/NESDIS Satellite Services Division
AMSU-b Rain Rates SSM/I Rain Rates TRMM Rain Rates AE Rain Rates Chantal Barry Humberto Helene AE TRaP AMSU-b TRaP SSM/I TRaP TRMM TRaP Future TRaP Initiatives Continued validation Automated operational TRaP products for: ALL STORMS... ALL THE TIME... WORLDWIDE TRaP Training: http://www.cira.colostate.edu/ramm/visit/trap.html
Combined geostationary / passive microwave rainfall estimates • Combines the best features of both approaches: • Good space/time resolution of geostationary estimates • Better accuracy of microwave estimates • How to do the combination? • 1. Blend rain estimates using weighted averages • 2. Use matched VIS/IR and microwave image set to: • (a) get a field of multiplicative correction factors • (b) recalibrate VIS/IR algorithm coefficients • (c) map IR TB onto microwave rainrates • (d) adaptive neural network • (e) morph microwave rainfall in space/time
Global Precipitation Climatology Project (GPCP) http://orbit-net.nesdis.noaa.gov/arad/gpcp/ Weighted average of rain estimates from: IR (GPI), SSM/I, TOVS, rain gauges Products available from GPCP @ 2.5° monthly resolution: monthly average rain rate 4-, 8-hour lag correlations of rain rate standard deviation of instantaneous rain rate frequency of rain sampling error for the monthly rain rate estimate fractional rainy area algorithm error for the monthly rain rate estimate number of available samples
Combined sensors Monthly mean rainfall http://trmm.gsfc.nasa.gov/images_dir/avg_rainrate.html Weighted average of TRMM, SSM/I, IR, rain gauges
Near real time SSM/I+TRMM3-hourly rainfall http://trmm.gsfc.nasa.gov/publications_dir/precipitation_msg.html Maps IR TB onto microwave rainrates, uses microwave in preference to IR where available
NRL hourly rainfall - "Blend" http://www.nrlmry.navy.mil:80/sat-bin/rain.cgi?GEO=aus Maps IR TB onto microwave rainrates
NRL hourly rainfall - "Merge" http://www.nrlmry.navy.mil:80/sat-bin/rain.cgi?GEO=aus Weighted average of several microwave rain estimates
PERSIANN Precipitation Estimation from Remotely Sensed Information using Artificial Neural Networks Uses an adaptive neural network to update the coefficients of an IR algorithm using surface or passive microwave rainfall observations. http://www2.hwr.arizona.edu/persiann/
Interpolated “observations” t+1/2 hr t+1 hr t+1.5 hr IR t+ 1/2 hr t+1 hr t+1.5 hr CMORPH Actual Microwave Observations t+0 t+2 hrs http://www.cpc.ncep.noaa.gov/products/janowiak/MW-precip_index.html
How accurate are satellite rain estimates? http://www.bom.gov.au/bmrc/wefor/staff/eee/SatRainVal/sat_val_aus.html
Summer 2002-03 Winter 2003 mwave IRmwave+IR mwave IRmwave+IR
GPCP Algorithm IntercomparisonProject results (1990's) • Skill greater over tropics than over higher latitudes • Passive microwave algorithms give most accurate instantaneous rain rate, esp. outside tropics • Geostationary algorithms give best monthly estimates due to better sampling • More recent IPWG results suggest that combining lots of microwave estimates overcomes microwave sampling limitations
Case study – 24 January 2003 TRMM mosaic http://trmm.gsfc.nasa.gov/publications_dir/australia_rain.html
Forecast situation:Convection in remote region with potential flash floodingWhich satellite guidance would you choose? Want rapid time sampling geostationary imagery Blended IR+microwave better than IR-only If not available then choose IR power-law algorithm, do a "reality check" against microwave estimates when possible