Download

1 / 10
100 likes | 235 Vues
This resource provides a comprehensive overview of the natural logarithm function, ln(x), essential for BC Calculus. It includes the definition of ln(x), the logarithmic integration rules, and examples of definite integrals involving ln(x). The resource also offers statistical plotting techniques, showing how to visualize ln(x) using graphing tools like the TI-83 calculator. Additionally, you will find information on anti-derivatives related to logarithmic functions. Perfect for students looking to enhance their understanding of calculus concepts.

E N D
4011- Natural Logarithm Function BC Calculus
f(t) The Natural Logarithmic Function 0 .405 .693 .916 1.098
f(t) The Natural Logarithmic Function -.223 -.511 -.916 -1.609
f(t) H(x) The Natural Logarithmic Function
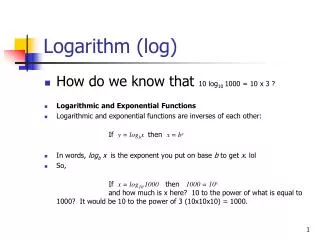
Definition of ln (x) DEFN: The Natural Logarithmic Function is defined by Log Rule for Integration:
L1 L2 1 0 1.5 .405 2 .693 2.5 .916 3 1.098 .8 -.223 .6 -.511 .4 -.916 .2 -1.609 STAT PLOT STAT ] EDIT 1: Edit ((fill the table)) [ 2nd ] ( Y= ) STAT PLOT 1: Plot 1 … On [ ZOOM ] 9: ZoomStat . . . . . . . . . . . . . . . [ Y = ] Y1 = ln (x) [ GRAPH]
Integration EX: EX: Definite Integrals
TRIG Anti-derivatives involving ln Given without Proof:
Last Update: • 02/1/10
L1 L2 1 0 1.5 .405 2 .693 2.5 .916 3 1.098 .8 -.223 .6 -.511 .4 -.916 .2 -1.609 REGRESSION on the TI-83 STAT ] EDIT 1: Edit ((fill the table)) [ 2nd ] ( Y= ) STAT PLOT 1: Plot 1 … On [ ZOOM ] 9: ZoomStat . . . . . . . . . . . . . . . [ Y = ] Y1 = ln (x) [ GRAPH]